13 Fans Will Be Arrested If The Steelers Win This Weekend

13 Fans Will Be Arrested If The Steelers Win This Weekend

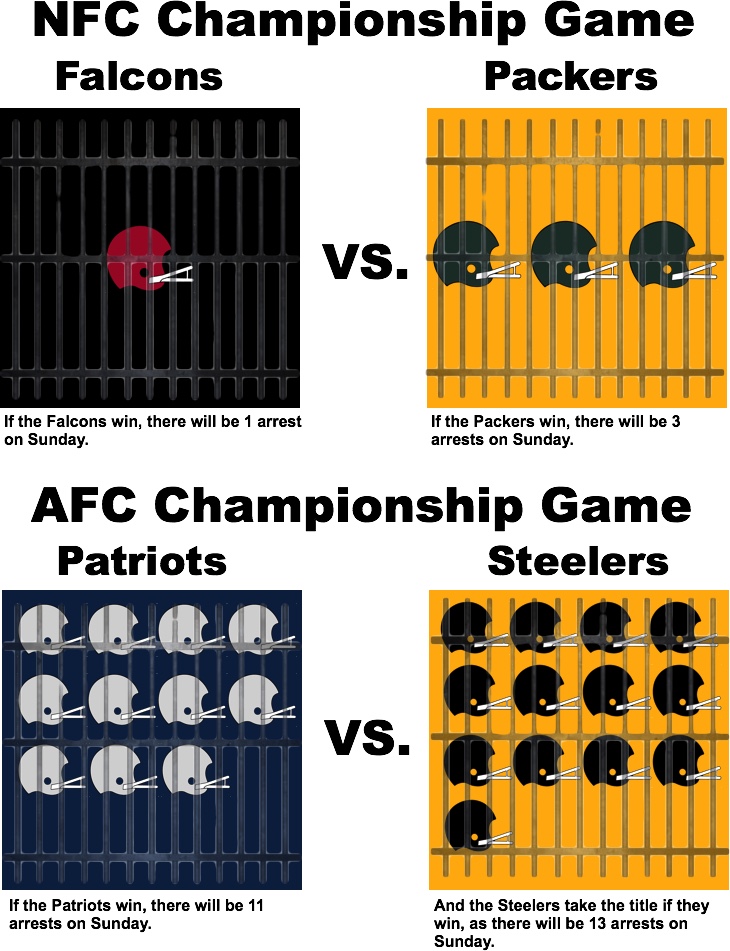
We can’t tell you which teams will win this weekend’s AFC and NFC championship games, but we can tell you how many people we think will be arrested at each. In Atlanta, if the Falcons win, 1 fan will be arrested. If Green Bay wins, 3 fans will be arrested. In Foxborough, if the Patriots win, 11 fans will be arrested. And if the Steelers win, 13 fans will be arrested.


How We Made These Predictions

In a grad level econometrics class at Purdue, my classmates and I were tasked with presenting statistical findings from socioeconomic data. While most economists are busy figuring out how to predict the next financial crisis, solve poverty, or predict how many people will buy their company’s next product, I was more interested in what I might be able to learn about my favorite rowdy NFL fans from the Washington Post’s NFL arrests dataset.

Kent Babb and Steven Rich of the Washington Post organized public record requests from police departments that oversaw NFL stadium security between 2011 and 2015, and they provided the total number of arrests made at each game along with other game-specific stats like the time of day that the game was played, the final scores of the home and away team, and whether or not it was a division game or went into overtime. Of the 31 jurisdictions in which there is an NFL stadium (note that the Giants and the Jets reside in the same jurisdiction), Cleveland and New Orleans were the only precincts that did not submit any data at all. Buffalo, Miami, and Oakland provided only partial records and had to be omitted from the data set, which honestly kind of sucks, because we know Oakland would have the GOAT arrest totals. Precincts in Detroit, Minneapolis, and Atlanta also excluded parking lot arrests, which means we might be missing a few booze-fueled tailgating arrests from this study.

I wanted to create a model to predict the chances of getting arrested at an NFL game. The Washington Post data set gave me a few of the pieces of the puzzle in knowing whether or not the home team won and the time of the game, but I had a few other questions.

  1. Did higher attendance relative to stadium capacity lead to rowdier fans, and, more arrests?
  2. Did people tend to drink more on a hot day and find themselves in the tank more often than cold days?
  3. Did controlling for local crime rates change the probability of being arrested?

In order to answer these questions, I merged data from Pro-Football Reference.com on game attendance, NFL stadium seating capacity from Wikipedia, game time weather from NFLSavant.com, and the FBI’s Uniform Crime Report with the Washington Post dataset to come up with the best overall look at local conditions during an NFL game that I could.

The Model

The model I generated from this data tells us that the probability of being arrested at an NFL game is higher if:

  1. The home team loses
  2. The game starts later
  3. Attendance is low relative to stadium capacity
  4. The weather is hot
  5. The local violent crime rate is high
  6. The local property crime rate is low 

If the model relied on factors 1, 3, and 4 alone, Jacksonville would have this one in the bag!

michael-jordan-jacksonville

I’ll explain the math used with broad strokes here, but if you really want the details, here’s the original term paper I submitted to Purdue. It should be noted that I received a 98% on the paper, which is enough of a confidence boost for me to publicly reveal this model. It should also be noted that my mom has yet to hang this term paper on the fridge.

The model was estimated using linear regression, and here is the primary equation:

arrest2attend = .0023167 – .000024hometeamwin + .0001295gametime – .000265attend2capac + .0000514ltemp + .0000508lhomeviocrmrt – .0003217lhomepropcrmrt

Let’s also take a second to explain each variable in the model:

  1. arrest2attend = total arrests at an NFL game divided by the total attendance for that game
  2. hometeamwin = 1 if the home team won, 0 if they lost
  3. gametime = the local time that the game was played expressed as a fraction of 1 (i.e. if the game had started at noon, it would be represented as .50 because noon is half way through the day)
  4. attend2capac = total game attendance divided by the stadium’s capacity
  5. ltemp = the natural log of the temperature (in Fahrenheit) during game play
  6. lhomeviocrmrt = the natural log of the local violent crime rate
  7. lhomepropcrmrt = the natural log of the local property crime rate

For the stats nerds out there, this model had an R-Squared of .2885, and the heteroskedastic robust standard errors for each independent variable implied statistical significance to at least the 10% level. For those who hated stats, this model was, scientifically speaking, not bad.

not-bad

The implications of the model actually make sense. If the home team loses, and we assume the majority of the crowd at any game is there to support the home team, we can expect a few upset fans to act irrationally, or, criminally. If the game starts later, there’s more time for tailgating and all the fun that comes with that.

The fact that lower relative attendance implied a higher probability of arrests may not reveal anything about social conditions at a game, but more about the nature of statistics. Let’s say 5 people each are arrested at 2 different games attended by 40,000 and 50,000 people, respectively. The chance of being arrested (arrests divided by attendance) at the game with lower attendance is 25% higher than that at the higher attended game, even though the total number of arrests was the same.

The weather is another interesting factor. Anecdotally, sun and heat lead to day drinking (naturally, Green Bay residents may be the exception). Heat can lead to higher instances of dehydration, which may lead to higher cases of public intoxication. But, this could also be a testament to regional cultures. Perhaps police forces in the south, where it’s warmer, are more likely to make arrests than in the north. Or maybe fans in warmer regions really are just rowdier than the north (though, back to our data omissions, we’d really like to officially verify this against Oakland and Buffalo).

With crime rates, one might attribute the difference in violent crime rates and property crime rates to police force allocation. In a region with high relative violent crime rates, precincts may be more likely to send officers into stadiums in an attempt to curb violence (our model thanks Philadelphia for not making the playoffs this year). In an area with higher relative property crime rates, precincts may be more likely to keep officers on the streets to deter theft and vandalism while the city is otherwise preoccupied with the game.

It should be noted that while the Washington Post’s data set included data from 2011-2015, I was only able to retrieve weather data from 2011-2013. So, this model is based on game data that is several years old, and should be taken with a grain of salt. That said, we used this model to predict the number of arrests that might occur this weekend at each conference championship game.

Predicting the Number of Arrests at This Weekend’s AFC and NFC Championship Games

We had to look at two outcomes for each game: one where the home team won, and one where they lost. From there, we just filled in the blanks on the model provided above. Green Bay at Atlanta is set to start at 3:05pm local (.628 in our time units), and Pittsburgh at New England is set to start at 6:40pm local (.778). Being conference championship games, we expect sellout crowds, so we set the attendance-to-capacity parameter to 1. The current game time forecast (as of the morning of January 19th, 2017) for Atlanta is 68 degrees Fahrenheit, and the same for Foxborough is 47. In Atlanta, the average violent crime rate for the last 4 years has been 399.3 for every 100,000 residents, and the property crime rate has been 3,374.4 out of 100,000. In Boston, the violent crime rate has been 507.3 out of 100,000, and the property crime rate has been 2,208 out of 100,000.

Plugging all of these numbers into the model above, and multiplying the expected probability of being arrested at each game by the expected attendance, we arrived at the predictions stated in the intro.

The results table looks something like this:

afc_and_nfc_championship_game_arrests_prediction

Conclusion

More than likely, the arrest figures we predicted here will not hold since we’re using regular season data obtained from 2011-2013 to predict events at postseason games played in 2017. In actuality, arrests may be higher due to the playoff atmosphere and likely larger security and police presence. Further, linear regression is not a perfect science, and this model cannot account for unexpected events like fan rioting, or some goofball in a hat and a red shirt showing up. Regardless, since the variables in the model make sense from a socioeconomic standpoint, it will be interesting to see how our predictions for this weekend’s game time arrests hold up in practice!


Let us solve your analytics problem.


    Google My Business Best Practices For Franchises

    Best Practices For Managing Google My Business Listings For Multiple Locations

    As a business with multiple locations, you want your locations to succeed in their local marketing, and one of the best online local marketing tools around is Google My Business. But to be successful at GMB, you need to not only create listings for all of your locations but also stay on top of keeping their information accurate. Managing one location isn’t that hard, but when you’re a franchise or multi-location business with dozens of locations, managing these can seem overwhelming. That’s why we’ve put together these tips to help franchises manage their Google My Business listings for multiple locations without being overwhelmed.

    1. Set your account up the right way

    The first step is to ensure that you meet the qualification guidelines set by Google to create and manage a Google My Business listing. Next, make sure that you’ve set up your account correctly so that you can manage your listings from one central location. If you have lots of locations that have never been centralized with Google My Business, you might have a mess at first because some of the locations may have great listings while others haven’t even claimed their business yet.

    For consistency and brand control, we recommend that the corporate office retains ownership of the Google My Business account and manages all of the locations. You can do this either in house or by hiring a marketing agency to manage your listings for you. While you can give your locations access to update their own Google listings, you’ll be at risk of them making changes to the account, and so you may want to restrict them to be a communications manager.
    If you don’t already manage your Google My Business listing, the first thing you need to do is set up an account. Create a Google account with your business name as the domain, for example, manager@acme.com. Next, you’ll need to create a Google business account, if you don’t already have one. This will be the main account that you manage all of the locations.

    As the business owner or manager, it’s important that you retain primary ownership of your Google My Business Account. You can add other managers and owners (either marketing agencies, third parties, or local owners) to your listings as needed. If you’ve worked with an agency in the past and they’re the primary owner, you have the right to ask for ownership of the account. This means that even if you change agencies, you’ll still retain control of your account.

    Some of your locations may already have listings they’ve claimed and manage. Request access and ownership to these listings by following these instructions.

    2. Gather Account Information From Each Location Into One Place

    It’s important that the information such as name and address that is on your location’s website matches their Google My Business listing and is consistent across all of your locations. If each of your location has the same name, i.e. “Sally’s Flower Shop” in each city, that is the name that should be on the Google My Business listing. You’ll also want to be consistent with address terms such as using “st” or “street” across all websites and local listings. This helps search engines recognize that it’s the same business and location across the web and ensures you’re listings aren’t competing against each other, resulting in lower search placement.

    The easiest way to collect this information is through a spreadsheet. If you qualify for a bulk upload (see below) you can download a spreadsheet to use directly from Google My Business. You’ll need at least the store ID (for internal use only), company name, website page to link to, physical address, phone number, and service category for each location. We recommend adding additional information such as hours of operation, business description, AdWords extensions, and more to give your customers more details about your business. Here’s a list of the different fields you can create in your Spreadsheet.

    If some of the information (such as hours) is different for each store, you can build a Google Form that feeds into your spreadsheet and send it to each store. You’ll just need to keep on top of your locations to make sure they fill out the necessary information.

    3. Add New Business Locations In Bulk (If You Qualify)

    There are two ways to add new businesses to your account: via bulk upload and by adding each listing individually. New businesses you could add include locations that were just opened* or locations that have never been claimed.

    If you have more than ten locations, you can choose to use the bulk uploader. You’ll use the spreadsheet you already created (or use the one Google provides) and check that all the information is correct. Then you’ll upload it at once. Google will let you know if there’s any discrepancies or errors in the information.

    There are some drawbacks to using the bulk upload method. First, there’s a character limit in the name and description field which can cut off text. Also, service area providers (where there isn’t a main physical location and services are provided at customer’s location) aren’t eligible for bulk verification.

    After you’ve uploaded your information, you can request bulk verification. Bulk verification is a lot faster than manual verification. For manual verification, each location is mailed a postcard with a code that you’ll need to enter into their business listing. This can take time, especially if locations accidentally throw away their postcard and it needs to be resent. But with bulk verification, all of the locations are verified at once through sending a verification form to Google through your account. You’ll need at least ten locations to be able to request bulk verification, and it may take up to a week to get processed and approved.

    *Never open a Google My Business account for a location that hasn’t opened yet. Your account could be disabled.

    4. Update Business Information Easily

    You can update information such as addresses, phone numbers, descriptions and more in bulk if you have at least ten locations. This is helpful if some of your locations already have listings, but they aren’t consistent with your other listings or have different information than their website.

    You’ll need to download your location information, make changes in the spreadsheet, and then upload them again to Google. By downloading the information, you can also see if there’s errors that Google has found or any updates Google made on their own. Follow these instructions on how to make edits.

    5. Hire Help As Needed

    Business owners and managers should stay informed and actively participate with their business listings, but using listing tools or hiring experts can help your listings perform better and take some of the workload off your shoulders.

    Local listing tools like Yext can help you manage your Google My Business account along with other local directory listings through one interface. If you want an even more hands off approach, hire a marketing agency.

    Marketing agencies can enhance your local listings and manage your photos, reviews, ad extensions, and more so that your listing shows up for customers looking for your services. Another benefit of hiring help is agencies can manage your local listings across many services such as Yelp, Bing, and other directories. Look for marketing agencies that have experience with local listings, communicate well about accounts and changes, and adhere to Google’s guidelines.

    Get Started With Local Listings Today

    If you’re a franchise or multi-location business that needs help with your Google My Business or other local listing directories, give us a call at 317-576-2855 for a free consultation. We’ll manage your local listings for you so that customers can find your local stores while you focus on other aspects of your company.


    Photo Credit: 123rf.com/abscent

    Let us solve your multi-location marketing problem.


      How to Troubleshoot Poor PPC Performance

      How To Troubleshoot Poor PPC Performance

      Perhaps you’ve just started a ppc account for your business or you’ve been utilizing ppc as a marketing channel for a while. At some point, you’ll likely experience less than stellar performance – and that’s okay as long as you know what steps to take to right the ship.

      In paid search, there are endless factors that can have an affect on your account’s performance: competition and industry bid costs, seasonality, world events, low account Quality Score, a new account that needs to build history, ineffective ad copy and landing pages, and the list goes on. Below, we’ve outlined a series of steps you can follow to start pinpointing when and how your account took a turn for the worse.


      Step 1: Determine the time frame that your PPC account hasn’t been performing at an ideal level.

      Start by running reports that compare this time frame to previous similar periods (week-over-week, month-over-month and year-over-year as available). It can also be helpful to know if your account typically performs consistently based on the day of the week so that you can spot emerging issues as they occur. When running your reports, you can start at the top level (think: campaigns or accounts if necessary) and work your way down to trouble ad groups and keywords. By looking at key metrics across various time frames such as: clicks, position, average cost-per-click, impression share, click-thru rate and conversion rate you can start to figure out if your issue stems from bids, new ad copy, an emerging competitor, or perhaps a landing page issue.

      It also helps to dig in to your change history or notes to see what major tests or seemingly small changes you made that actually had a larger than expected impact. You can easily adjust or reverse these changes if you find them directly in Adwords.


      Step 2: Utilize Analytics 

      If your conversion rates have stalled or even been declining, it can be helpful to dig in to analytics and see what you can discover about how your ppc users are navigating your pages. One place to start in all of the analytics data available to you would be your landing page bounce rate. Some bounces are fine and to be expected, but if your rate is exceptionally higher than average on some page or has been increasing, it could be cause for concern. Figuring out which landing pages and more specifically, keywords, have high bounce rates can help you determine where to focus your optimizations. To decrease bounce rates, you can implement strategies such as: better directing keywords to pages that match a user’s search query, implement a more logical and functional path to conversion, and/or test your page’s call-to-action. In addition to these higher-level findings, be sure to drill in to deeper insights such as how your traffic is performing by device type.


      Step 3: Check Conversion Tracking

      A more obvious step in the process is to check on conversion tracking. If you have many conversion points on your site such as call tracking, a form, email links, and secondary/tertiary “soft” conversion points like clicks to specific pages, etc. you’ll want to know how to check in on these points when something seems off. For Adwords conversion tracking, a quick look under the conversion section (Tools > Conversions) of your account will help you identify any conversion points that haven’t recently been seen or fired on your website. Navigate to the Tracking Status column to see how each one is performing. If the status shows unverified or tag inactive, you likely have an issue. You can follow these steps to troubleshoot the tracking issue. An easier way (especially if you’re an agency or a representative of a company) to implement and keep tabs on conversion tracking is to utilize Google Tag Manager or GTM. This tool is especially helpful when your marketing, development and client teams are working toward similar goals but separated from one-another. You can easily use Google’s Tag Assistant to check that pixels are firing as they should when goals are completed. Google Tag Manager is also especially helpful in multi-site situations, such as multiple locations or multiple brands under the same umbrella.


      Step 4: Check Your Automation

      PPC automation can be a very helpful tool, but it can also work against you if left unchecked. You can set up your automation to email you every time the system makes a scheduled change, but this can still cause an out-of-site-out-of-mind mentality. By periodically checking in on automated rules or rules set within 3rd party bid management software that are intended to control bids and make changes based on performance you can avoid this mentality.


      Step 5: Be proactive and keep tabs on your account’s trends and Quality Score over time.

      Lastly, I recommend finding a way to be proactive when it comes to emerging ppc trouble. Find a reporting method that works for you and keep tabs on your accounts on at least a weekly basis and compare your performance week-to-week so you can predict when your cost-per-lead is going to spike or leads will be below a needed threshold. The main way to see how your efforts are paying off involves Quality Score. You can’t see your historical Quality Score, so it’s a good idea to find a way to keep tabs on it. Adwords offers many scripts to improve your ppc and reporting such as Quality Score tracking.


      Photo Credit: 123rf.com/bplanet

      Let us solve your PPC problem.


        Creating a Custom Facebook Audience by Passing Variables from Your Website with Google Tag Manager

        Motivation

        Let’s say your company owns 10 car dealerships in 3 different cities. Dealerships A, B, & C are located in City 1, Dealerships D, E, & F are located in City 2, and Dealerships G, H, I, & J are located in City 3. Each of these dealerships offers 3 types of car: Trucks, Sedans, and Minivans.

        Let’s say a potential customer visits Dealership A’s website and looks at a Sedan, but does not convert. We might assume that the user is looking for a Sedan in City 1, but has not yet made a decision on which Sedan to buy. Using a custom Facebook audience, we could show this user an ad containing links to the different Sedan offerings at Dealerships A, B & C, since they are all located in City 1. Using the Data Layer and Facebook’s Conversion Pixel, this is actually a fairly simple setup.

        Define Variables with Data Layer and Google Tag Manager

        For our example, we really only need to know two things:

        1. The city where the dealership is located
        2. The car type that the user viewed

        Let’s define these variables as dealerCity and carType. You will need to pass these variables to the data layer, which is a subject you can learn more about here.

        Now you will need to create these variables within Google Tag Manager. Navigate to the User-Defined Variables box in the Variables tab, and click New. Assuming that the values of these variables will be available in your site’s data layer, you can choose the Data Layer Variable configuration type, and simply input the variable name in the field.

        Note: If you are having trouble getting your data layer to populate properly, but you can define either of these variables with URL information (such as a query string containing something like ?dealerCity=Indianapolis&&carType=Sedan), then you might try creating a lookup table instead of a data layer variable. You can read more about the lookup table macro here and here.

        Facebook Pixel Tag

        If you have not yet created your Facebook pixel, read how to do so here.

        Now you’ll need to add your Facebook Pixel as a tag in GTM. Create a new tag and name this tag Facebook Pixel All Pages, or, whatever naming convention you’d like to use to indicate that this is your base tag for Facebook. Paste the code generated by Facebook into a Custom HTML Tag Configuration, and set this tag to fire on all pages. This will ensure that Facebook’s pixel is always active and ready to pass data back to your Facebook Ad Account.

        Tag for Custom Facebook Event

        Now we want to create a custom event tag that passes your custom data into Facebook. Facebook uses the fbq call to indicate data arrays, and the trackCustom call for passing non-standard arrays (Facebook supports 9 standard data types, which you can read about here).

        The code below is intended to send a City_Cars event array to your Facebook conversion pixel, containing the variables dealerCity and carType. Within Facebook, the variables dealercity_id and cartype_id will carry the data layer values in {{dealerCity}} and {{carType}}.

        <script>
        fbq('track','City_Cars', {
        dealercity_id: '{{dealerCity}}',
        cartype_id: '{{carType}}'
        });
        </script>
        
        <noscript>
        <img height="1" width="1" style="display:none"
        src="https://www.facebook.com/tr?id=1111111111111111&ev=City_Cars&cd[dealercity_id]={{dealerCity}}&cd[cartype_id]={{carType}}&noscript=1"
        /></noscript>

        Note that you must define these variables in both the fbq call and the query string on the URL within the <noscript> section. The number contained in id=1111111111111111 will be equal to the ID number in your standard Facebook conversion pixel. Set ev= to the name of the event (City_Cars in our case), and then follow the format &cd[variable_id]={{GTM variable name}} for all values contained within the fbq array.

        Under Tag Sequencing, make sure that your Facebook Pixel All Pages tag is firing first. This is important, as your Facebook Pixel must be active before data can be passed through it.

        Set Up Custom Audience in Facebook

        Let’s now create the remarketing list for potential customers looking for Sedans in City 1.

        Go to the Audiences section of your Ads Manager and click Create Audience. Under the Website Traffic dropdown, choose Custom Combination. Then, under the Include drop-down, choose Event, and enter City_Cars in the Choose an event field. Now you will be able to add the individual parameters dealercity_id and cartypes_id and choose the values City 1 and Sedan, respectively.

        Now you can use your new audience to target potential buyers who are interested in finding a Sedan in City 1. You can also set up an audience for each city and car type combination, and set up ads that target each unique pairing.


        Photo Credit: 123rf.com/graphiqa

        Let us solve your Facebook advertising problem.


          Local directory listings for franchises

          The 5 Ws Of Local Directory Listing For Franchises And Multi-location Businesses

          Your customers use local directory listings every day. And most likely, you do, too. If you’ve never heard of the term — no worries. This article is a quick overview of the who, what, where, when, why and how of local directory listings.

          Who Uses Local Directory Listings? (Hint, hint: your potential customers)

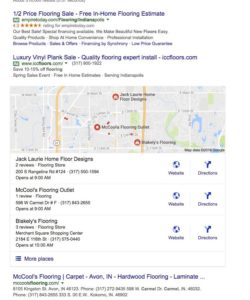
          Almost any online search for a local product or service will pull up a local directory listing result. To see how this works, let’s talk about a woman named Susan. Susan had just moved into a new home and wanted to redo her flooring. But since she was new to the area, she didn’t know what flooring stores she should choose. So she went online to Google and typed in “Flooring in Carmel, IN.” This was her result.

          Indiana Local listing directory results for flooring

          At the top she saw ads for local area providers, but what really drew her attention was the map which showed her where flooring stores in her local area were. This was very helpful because she could see which stores were closest to her, customer reviews for the stores, and the hours which they were open. She also could click through to a store’s website and learn even more about their flooring products and services. So she browsed through a few flooring websites and then went to bed.

          The next day, after work, Susan was on her mobile phone and again typed in “Flooring in Carmel, IN.” She saw the store that was closest to her work, and remembered that she liked what they had on their website. So she clicked on “Get Directions” and showed up in their showroom minutes later.

          The local flooring business gained Susan as a lead simply because they had a local directory listing with Google which they optimized to draw more customers into their store.

          What Is A Local Directory Listing?

          A local directory listing is a listing of your company’s basic NAP information – name, address, phone number – with a directory like Google, Bing, Yelp, or even smaller directory services. It’s similar to the old phone book listings, but it’s online where most people go to search for products. It can also include additional information such as hours of operation, website links, customer reviews, photos and more if you add those features. When customers search for local products and services these directory listings will pop up. Some people also go directly to the directory (like Yelp) and search through the listings there.

          Local directory listings aren’t just for local mom-and-pop stores. National brands and franchises compete with local stores for customers’ attention and business. So you want to make it easy for customers who are searching online for your local services to contact you through local listings.

          Where Should My Stores Be Listed?

          You’ll want to start off by listing your stores on the major directories like Google and Bing. Then, depending on your industry, you’ll want to find the smaller directories that cater to your products. If you’re a restaurant, you’ll want to be included on Yelp, and touristy directories like TripAdvisor. In order to rise to the top of the listings, you’ll want to optimize your listings for the directories.

          When Should I Start Creating And Optimizing My Local Directory Listings?

          If you don’t currently have directory listings with the major publishers, then it’s time to get started. Sometimes the verification process can take a couple of weeks, and so the earlier you start, the better. And if you have lots of stores that need directory listing, that takes time as well. If you’re already listed on the major directories, look through your listings to see what you can do to optimize them and show up higher on the search list.

          It’s possible for your business to show up in a local directory listing even if you haven’t officially registered it. However, you’ll see a lot more benefits after you’ve claimed your listing such as the ability to display your hours, link to your website, have customer reviews, and more.

          Why Should My Stores Have Local Listings?

          Local directory listings put your company’s information right in front of your customers when they’re searching locally for your products and services. For multi-location businesses, local listings are crucial for your store’s local marketing success.

          Local listings can also improve your store’s website’s SEO value. One of our clients had a local store that didn’t verify their address with Google Places for months and months. We finally got them to verify their location and their SEO traffic doubled in one month. That’s the power of local listing, especially with Google.

          Bonus: How Do I List My Store On Local Directories?

          Listing your stores on local directories can be hard and take time. One of the biggest challenges is making sure that you are consistent with how you format your name, address, phone number, etc., across all of your locations. The first place we recommend listing is with Google My Business. If you are listing more than ten stores at once and you meet their guidelines, you may be able to do a bulk upload of the store’s information. If you don’t meet their guidelines, you’ll need to input the store’s information one by one. So we recommend creating a spreadsheet of all the information you’ll need from each store and then contacting the stores to get all of the information.

          Google My Business (also known as Google Places) will send out a postcard with a verification code to each store’s physical location. So make sure that your stores are on the lookout for the postcard and that they contact you with the information so that they can be verified and claim their local listing.

          Once you’ve listed your stores on Google, hit the next major listings. Each of these directories will have a different way of verifying your location such as email, phone call or mail.

          After you’re on the major directories, start looking into smaller directories. You can use directory services like Moz, Yext, or work with an agency like Flint Analytics to manage these directory listings. Some of these services let you list your business from one interface to over 50 different directories and keep your listings consistent.

          Local directory listings are an important part of local online marketing success and can increase your online visibility with customers. If you want to know more about local directory listing for your multi-location business, contact us today.


          Photo credit: 123rf.com/denchik

          Let us solve your franchise marketing problem.


            franchisee websites

            Why Your Franchisees Are Marketing On Their Own Without Your Help

            Local stores and franchisees are running their own online marketing efforts. We see it every day. These are often non-sanctioned marketing efforts. Even if they are allowed, they aren’t up to the standards of the parent company. The store could have created a rogue Facebook account, website, print campaign, or even television commercials.

            But, why does the local store or franchisee do it? Why do they use their valuable time to run their own campaigns when they could just rely on the corporate campaigns and spending time running their business? There are several reasons for it, but they all stem from one thing. They aren’t satisfied with the help they are getting from corporate in driving business growth for their own store. And they are getting great results by doing it on their own.

            So why aren’t they satisfied with the corporate marketing efforts? Because:

            • Corporate is focused on the whole nation and not the intricacies of their market.
            • Corporate efforts are not getting enough business out the gate for a newly established market.
            • Corporate search efforts are mainly on broad national search terms and not localized search terms.
            • They like to do things their own way.

            National Campaigns Not Relevant

            The franchise or corporate entity has limited resources and wants to use those the best they can. This often leads to nationally focused marketing campaigns that don’t take into account local variance. When you are selling HVAC services in Detroit and Miami, the message and concerns of the customer are different. You have to approach them differently. The Detroit customers have to worry about efficiently heating and cooling their home, while the Miami customers primarily worries about cooling their home and ensuring the comfortable existence in a high humidity area. The systems you install are different and the questions the customer has are different. Approaching them differently leads to a better buying experience where both parties are more likely to buy.

            Nationally focused ad campaigns make it hard to accomplish this. Many national brands are doing a better job of this in their offline channels, ensuring that different areas are mentioned or that the pictures of the homes in their ads match the area. Likely because they have learned a lot about variable printing over the years. But, most are not doing the best when it comes to applying this strategy to the web, where more and more marketing dollars are being allocated every year as customers spend more time looking at computer screens and mobile devices.

            One franchisee that we talked to did his own marketing and mentioned that the reason he did it is because people in his market didn’t understand the product as well. He said that in the hot markets for the company, customers only cared about how much, how fast, and what the quality was. Those markets didn’t need product category education. But, in his market, what customers cared about was knowing if the product would work in their home? What are the benefits? Does it fit with my home style?

            Another thing about national only campaign strategies is that customers often want to work with a small business. While it is hard to consider many franchises as small businesses, locally based marketing strategies make franchises appear more local to the customer. They let the local business not only tell the national brand’s story, but the individual owner’s story as well. This ties the brand to the local community, making the business appear smaller to the customer as they feel they could actually talk to the person in charge.

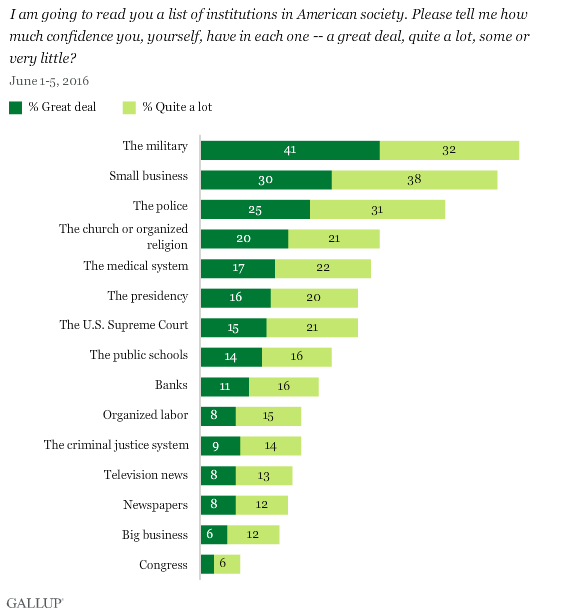
            gallup_trust_in_institutions_survey

            Wow, you don’t want to be perceived as big business!


            From the chart above, it shows that there is a 50 point spread between how much confidence a person in America has in small business versus their confidence in big business. With multi-location businesses then, you need to emphasize what is local about you, and that contributes to the desire of the location to wanting to do their own marketing.

            Newly established market

            When you are a new market for an existing franchise the marketing rules for your existing stores do not apply. Existing stores often need to do less education for current customers. But, a new store with a new product that the area hasn’t seen or completely grasped yet needs more dollars thrown towards education. Often, franchises approach the rollout of a new store with the same effort as they do for every other store. When in reality new stores need more money and need to hit more avenues for opening up business. This is partly because this new store does not have an existing book of business.

            So when a new store launches they are often grasping for anything that can help them get off the ground, which makes them look for cost effective marketing solutions to help them in their market. This means, they start their own social media accounts and start posting. And since website costs have gone down, they may start a new website, but it often doesn’t meet corporate standards or corporate strategy. Maybe the corporate standards should change online then. And it is getting easier than ever for them to do this.

            Power Of Local Search

            I am going to put this out there and it will be surprising for most of you. Local small businesses can dominate the searches in their local market, and beat out large corporations. A well-run marketing campaign by the local business in a given market is almost always going to out-perform the national chain in the search engines, particularly Google. I see it every day. Just look at the following searches to see local companies organically ranking higher in organic results and even maps listings:

            A few things to notice as you check out geo-targeted search terms in these markets. In all these cases the top or near the top searches are local businesses with a strong web presence. Sometimes they directly link of many local businesses such as a Yellow pages and other local directories. But, you will notice that the large national chain sites are hard to see. In fact, the best ranked national brands have local websites of their own as well. Over time this will become more and more commonplace. You will see more businesses and corporations using local websites to compete in search.

            The calculation is simple. In Google’s and the customers’ opinion, what is more relevant: a corporate site with one page about that product or service in your area, or an entire website about that product or service in your area? This is especially true when it comes to more locally relevant content that refers to needs in that specific market. But, beware, there are right ways and wrong ways to do this. And unless you have the right website solution, the undertaking will be huge or the results will be poor due to the sites not being unique enough. So, seek out the right solution to make this work for your locations.

            Any store that has started their own website has seen the benefits of having their own website. And it isn’t just increased traffic, it is increased conversion rates as well.

            Doing Things Their Own Way

            Many executives view stores that do their own marketing as owners or managers who just like to do their own thing, in their own way. They think that they simply want more control. And because they want to do things their own way, they aren’t being a team player, and they should stop their efforts. They also then devalue the work and insights that the local store came up with. The problem with that thinking is that if they are spending their own time and money on those efforts, then they likely have a very good reason for doing so.

            It also means it might be time to learn from their efforts as they are a great experiment for you. While they might have done a poor job on their marketing or might have done marketing they shouldn’t have, they likely know have a lot of knowledge that can be applied to their specific business. And if you want to investigate doing your own local online marketing programs, these stores are a good place to start. Bottom line, no stores are really doing this, simply because they like to do things their own way. They are doing it because it works for them.

            By combining their knowledge with corporate resources you can create a great program for every store.If you are ready to start talking to these stores and begin creating more localized marketing programs, give us a call.


            Photo Credit: 123rf.com/ehrlif

            Let us solve your franchise marketing problem.


              Setting Up Enhanced Ecommerce Using Google Tag Manager and the Data Layer

              Enhanced Ecommerce is hard. Like, frustratingly hard. The setup is complex, time-consuming, and downright confusing, and it doesn’t help that Google’s support documents for the setup process are scattered and incomplete. But here at Flint Analytics, we decided to take all this disjointed documentation and bundle it all together in one mega-guide to understanding the Enhanced Ecommerce setup from start to finish. This post is intended to help you understand both the big picture reasons and nitty-gritty, step-by-step details in implementing Enhanced Ecommerce using Google Tag Manager and the Data Layer. The entire setup requires a fundamental understanding of some key factors, thus the sections are broken down as follows:

              1. What is Enhanced Ecommerce?

              Understanding the reporting capabilities of Enhanced Ecommerce and the business motivation behind it.

              1. Understanding Ecommerce Data Types

              Enhanced Ecommerce recognizes four data types (impression data, product data, promotion data, and action data), and this section describes the application and capabilities of each data type.

              1. Defining Tracking Requirements

              Using the motivations and understanding from sections 1 and 2, you’ll need to figure out the specific tracking needs of the ecommerce site.

              1. Setting up the Data Layer

              Converting variables from an ecommerce database into a format readable by Google Tag Manager.

              1. Configuring Google Tag Manager

              Tag Manager will be used to facilitate the passing of data from the Data Layer to Google Analytics. This will require defining tags and variables.

              1. Setting up Google Analytics

              How to enable Enhanced Ecommerce in a View and how to set up the Checkout Funnel.


              Section 1. What is Enhanced Ecommerce?

              Enhanced Ecommerce allows sites to segment their shopping behavior in a more granular way than the standard ecommerce and conversion reports in Google Analytics. Via this Google Support article, Enhanced Ecommerce provides the following metrics and reports that standard ecommerce and Google Analytics do not provide.

              Shopping Behavior Analysis

              This report allows you to analyze general site behavior from product impressions to transactions. So say, for instance, you wanted to know conversion rates between the following steps:

              1. Session Starts
              2. Product Impressions/Views
              3. Adds to Cart
              4. Checkouts
              5. Completed Transactions

              This type of granularity allows you to find high-level inefficiencies in your sales funnel and gives a basis for making improvements. Here is an example of a Shopping Behavior Analysis report.
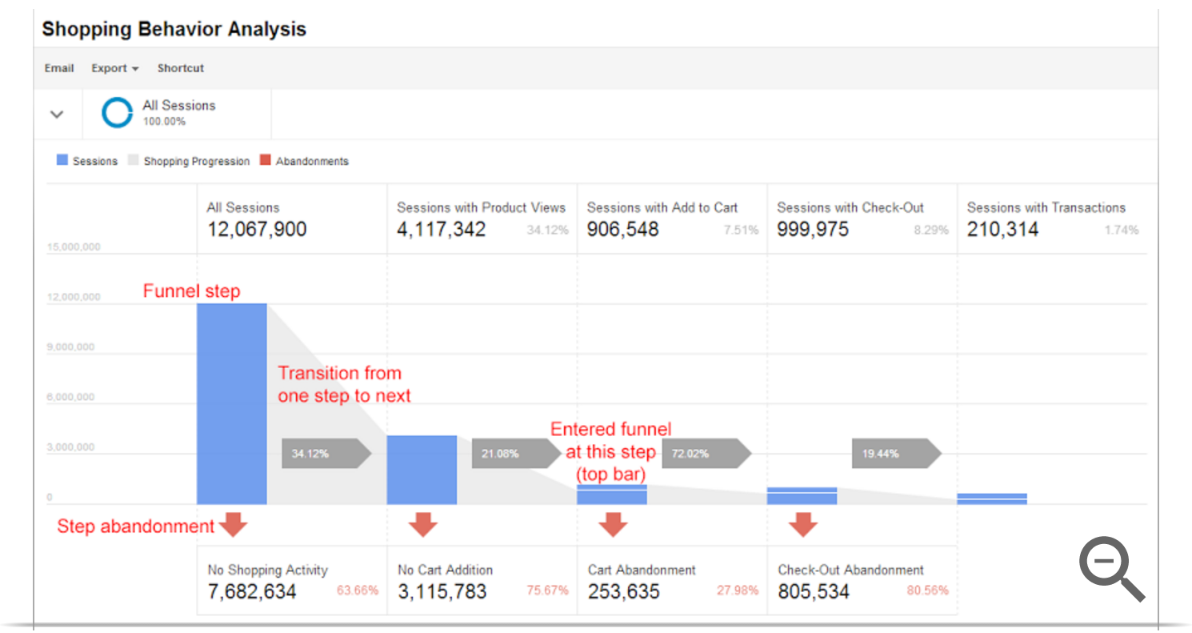
              Enhanced Ecommerce Shopping Behavior Analysis Example

              Checkout Behavior Analysis

              This report is very similar to the Shopping Behavior Analysis report, but instead it is broken down into your checkout funnel steps. So, for example, let’s say that when a user on your site initiates the checkout process and carries through to a transaction, they follow these steps:

              1. Login
              2. Customer Information
              3. Billing Information
              4. Review Order
              5. Confirmation

              This report would allow you to identify choke points in your checkout process and make improvements accordingly.

              Product Performance

              These reports allow you to view stats related to specific products. So say your store sold three types of shirts: green, yellow, and red. Where the Shopping Behavior Analysis and Checkout Behavior Analysis reports would show aggregate information for all shirts, a Product Performance Report would show information only about green shirts, yellow shirts, or red. From this report we can see ratios like the number of products added to cart and purchased compared to their total views, as well as product revenue, number of purchases, quantity sold, average price/quantity, number of refunds, impressions and product views, cart additions and removals, and whether or not the product was part of a list (to be discussed in detail later).

              Sales Performance

              This report shows all details related to ecommerce revenue, including transaction details, taxes, shipping, refunds, and quantity sold.

              Product List Performance

              Going back to our shirt example, let’s say the green, yellow, and red shirts are part of your “Stoplight Collection” (branding genius, I know). From an Enhanced Ecommerce perspective, these shirts would belong to the Stoplight Collection List. From this report, you’ll be able to break down the views and clicks through to a specific product from a list.

              Internal Promotion

              If you have any marketing materials on your site, say for instance an advertisement for a sale, you can categorize user behavior by the amount of impressions and clicks on promotions.

              Order Coupon and Product Coupon

              This allows you to segment data based on whether or not a coupon was used at either the product or order level.

              Affiliate Code

              If you have any affiliates, you can segment revenue based on their performance.


              Section 2. Understanding Enhanced Ecommerce Data Types

              Enhanced Ecommerce reports are dependent on a consistent and well-structured data stream. This is accomplished through implementing a richer Data Layer structure on the site that sends information in the form of impression data, product data, promotion data, and action data.

              Impression Data

              Say you want to know the conversion rate for a single product, from start to finish. For example, when somebody loads the homepage of your ecommerce site, they see a list of products: 3 shirts, 3 books, and 3 toys, summing to 9 total product impressions on that homepage. Each of those products may be shown on other pages within the site as well, as the customer continues browsing. Let’s say one of our shirts is shown on 3 different pages each during 10 different sessions. That would be 30 impressions of the same shirt across all 10 sessions. Let’s also say that during those 10 sessions, the shirt was purchased 1 time. So, the conversion rate for that shirt with respect to number of impressions would be 1/30 = 3.33%.

              Each shirt, book, and toy is different from the other shirt, book, and toy, and carries with it some specific information on brand, category, price, etc. In the Data Layer, you can define an impressionFieldObject, which is an array containing all of the information about a specific product that is being viewed. So now let’s say you wanted to know the category conversion rate, where in this case, the categories are shirts, books, and toys. Let’s assume all 3 shirts are shown on all 3 pages during each of the 10 sessions, totaling to 90 shirts impressions. Let’s also assume that 5 shirts were purchased in the 10 sessions. The shirts conversion rate with respect to impressions is now 2/90 = 2.22%.

              So, the general motivation for tracking product impressions is to allow ecommerce sites to segment their various products by different parameters for understanding conversion behavior. The following table lists and describes the variables that Google recognizes automatically in the impressionFieldObject array.
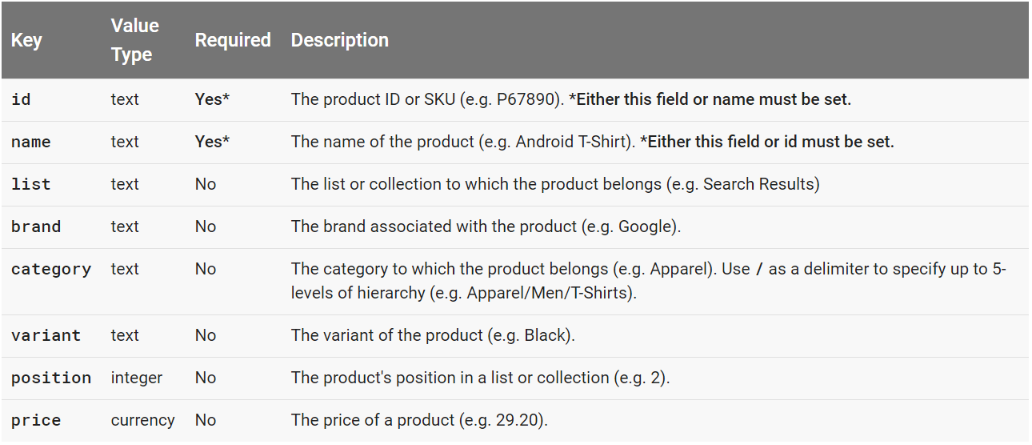
              Enhanced Ecommerce impressionFieldObject Variables

              Product Data

              Let’s go back to our original shirt example, where the same shirt was shown on 3 different pages during 10 sessions. Let’s say each impression of this shirt contains a link that directs to another page containing more information, or details, about the shirt itself. Of those 30 impressions, 3 of the 10 users click on the shirt during their session. That would mean that 3/30 = 10% of the product impressions result in the user clicking through to view more details about the product. This information can be used to understand what images/copy users respond to on the site, which products garner more interest, etc.

              The productFieldObject array contains information specific to the product being viewed, and the following table contains variables that are automatically recognized by Google in this array.
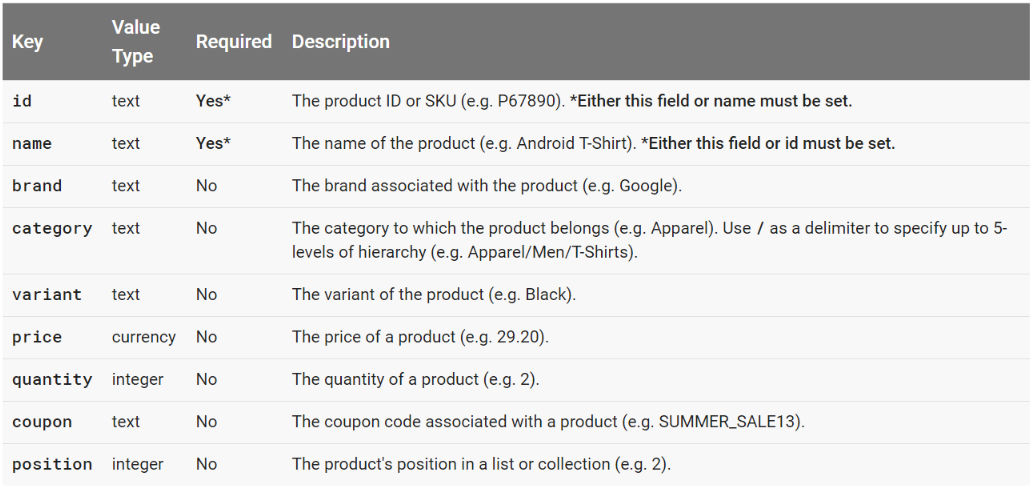
              Enhanced Ecommerce productFieldObject Variables

              Promotion Data

              Say an ecommerce site is advertising a promotion on certain pages, such as an ad for a sale. You might want to know if the promotion has any effect on purchase volume and revenue, so you’ll want to know conversion rates relative to promotion impressions. The effect of specific promotions can be segmented using the variables in a promoFieldObject, which is described in the table below.

              Enhanced Ecommerce promoFieldObject Variables

              Action Data

              Within an ecommerce site, several ecommerce-related actions can occur. Returning to our shirt example, let’s say you are currently on the product detail page for a specific shirt and you decide that you like the shirt enough to buy it. The first thing you’ll do is add that shirt to your cart. Then maybe that action will take you to the first step of the checkout process. Maybe you had previously added another shirt to the cart, but you’d rather have the new one, so you remove the original shirt from your cart. Now that you’ve got your cart in order, you finish the checkout process and make a purchase.

              Each of these items is an action, and the following table lists and describes all of the ecommerce actions that Google recognizes automatically.
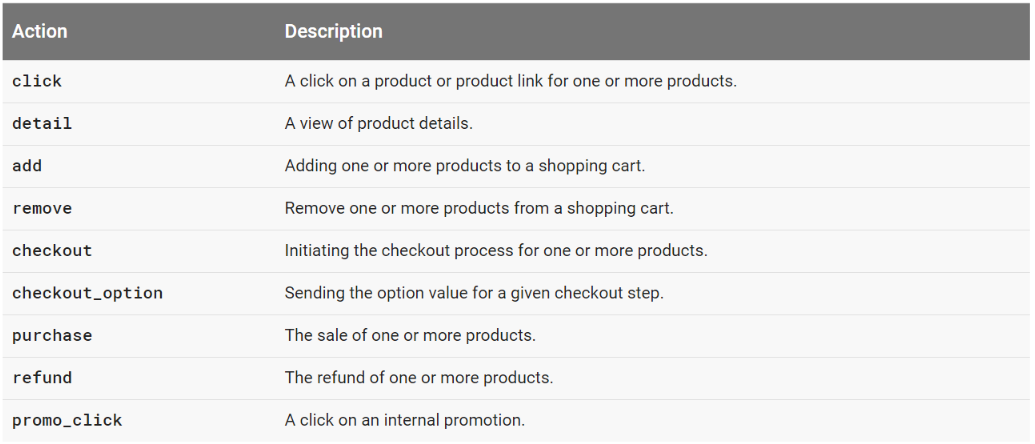
              Enhanced Ecommerce Actions

              Each of these actions can carry action-specific data as well, which is defined by the actionFieldObject. On a purchase, for example, you would want to know total revenue of the transaction as well as the tax and shipping on the items sold. For an item being added to a cart, you might want to know which list it originated from (example, tickets for a specific Cincinnati Reds game might have originated from a list of upcoming Cincinnati Reds games).

              Here are the specific variables recognized automatically by Google in the actionFieldObject.
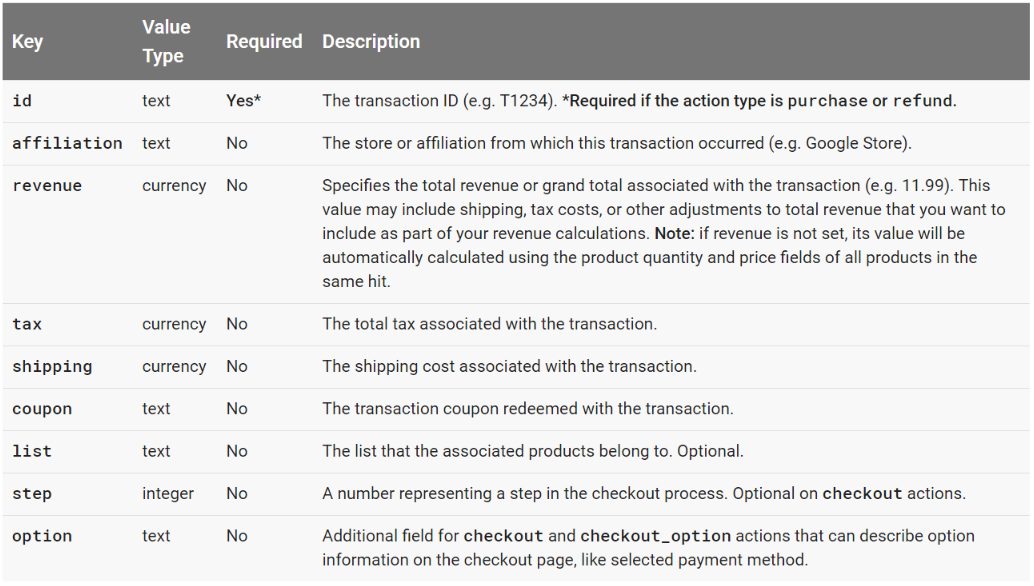
              Enhanced Ecommerce actionFieldObject Variables


              Section 3. Defining Tracking Requirements

              This portion of the process requires a fundamental understanding of the ecommerce site’s business model, Google’s predefined data types, and the types of reporting questions you may have. Let’s use Google’s fictitious Demo Store, Ibby’s T-Shirt Shop as an example for determining tracking requirements.

              Ibby’s T-Shirt Shop Business Model

              Ibby sells t-shirts. Those t-shirts have different colors, sizes, brands, prices, etc. When somebody goes to the site’s homepage, they are greeted with a list of different t-shirts (Compton, Comverges, Flexigen, etc). The user can choose which shirts to view and, potentially, purchase. When somebody makes a purchase, Ibby’s revenue is the price of the t-shirts sold multiplied by the quantity plus the tax cost plus the shipping cost.

              It’s a pretty simple financial model, but how does Ibby know how to optimize the flow of her site to result in more purchases or higher revenue? That’s where defining the tracking requirements comes in.

              Ibby’s Tracking Requirements

              Using the lingo from Section 2, as well as Ibby’s website, let’s translate the entire sales process into Enhanced Ecommerce-speak. In the next section we will discuss the technical process for passing this data, but for now we just want to provide a framework for understanding what’s important from a business standpoint.

              Product Impressions

              In order to properly track the sales cycle of a product from start to finish, we want to track details specific to each impression of a product. On the homepage of Ibby’s site, note that each shirt can be uniquely identified through text (name, price, and ID) or picture (blank yellow shirt vs pink shirt with brick wall). Assumedly, your product database will contain all of the information unique to each product and you will want to pass this to Google Analytics for easier analysis. Refer back to the impressionFieldObject array described earlier: while it is required that you track product id and name, you should also track any of the following that you have available: list (ie homepage product list, suggested items list), brand, category (ie t-shirts, books, toys), variant (ie yellow, red), position (relative to other items in list), and price.

              Product Clicks and Product Detail Impressions

              While product impressions give users a preview of the t-shirts Ibby offers, product detail impressions give users more information and the option to add a specific shirt to their cart. Say you’re interested in the Flexigen T-Shirt, so you click (remember this is a defined action type) through to its product detail page. Most of the variables in the productFieldObject are the same as the impressionFieldObject, and with good reason: we want to have consistency when reporting the number of users who see a product on the site (product impression) and then choose to learn more about it (product detail impression).

              Add Product to Cart

              You’re on the product detail page and you’ve decided you’re going to buy the shirt. You choose the trim color and the size and then click the ‘Add To Cart’ button. Ibby may want to know the most popular color and size for the Flexigen T-Shirt, so she would define these in the productFieldObject for the add to cart action. As we saw before, variant is a predefined type, so we may assign trim color to that field. Since we can only use variant once, we’ll also need a way to track the size, which we can do with a custom dimension in the array (we will discuss the specifics of this implementation later, but it is important to note that most anything can be tracked, even variables outside of the scope of those that Google recognizes automatically).

              Checkout

              Ibby’s checkout process involves 5 steps:

              1. Start Checkout
              2. Customer Information
              3. Billing Information
              4. Review Cart
              5. Confirmation

              In each of these steps, we will carry through the original product detail array that was populated during the add to cart action, and we will also track events that lead to cart abandonment.

              Note on step 3, we have the option as a customer to select Visa, Mastercard, or AmEx as our preferred method of payment. This will be defined as a checkout option, another custom item that can be tracked for analysis purposes.

              Purchase

              This is the obvious goal for an ecommerce business, and we want to make sure that we are actively tracking the entire product detail array through to the purchase so that we can make optimizations and accurate reports about the entire sales process.

              Other Variables and Actions That May Occur

              Remember that somebody can usually remove an item from their cart, view or click on a promotion, request a refund, leave the checkout to continue shopping and return, etc. Review the data and action types from section 2 to determine what other variables and actions you may want to track.


              Section 4. Setting Up the Data Layer

              In short, the Data Layer is a JavaScript array that contains data readable by Google Tag Manager. If you are not familiar with the Data Layer, read this Google article first before proceeding.

              How It Works

              Via Simo Ahava, Enhanced Ecommerce via the Data Layer works in 4 simple steps:
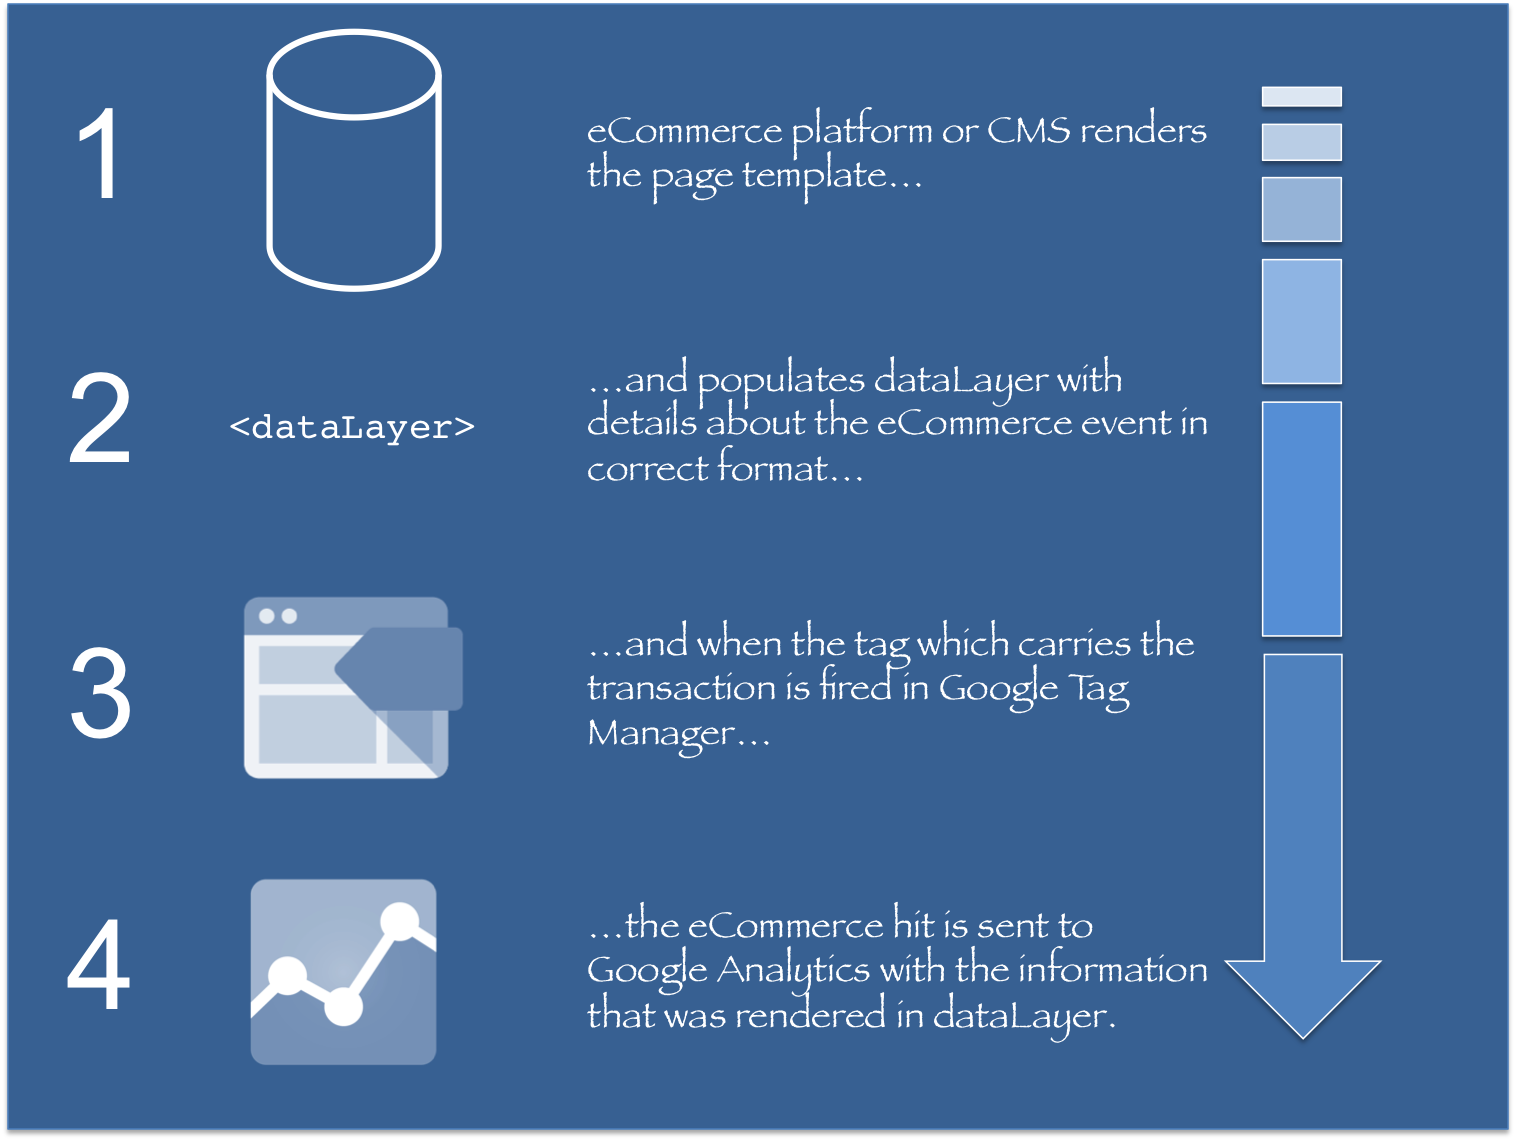
              Simo Ahava Explains How Enhanced Ecommerce Works

              So essentially, the Data Layer translates data from the site’s platform, CMS, or database and converts it to a format readable by Google Tag Manager and then Google Analytics. This is important to note, as this particular piece of the puzzle will require the most communication with the development team.

              Data Layer Code for Each Type of Action and View

              We will use Ibby’s T-Shirt Shop as the example for each type of implementation, providing page-specific links for each step, so you can follow along for a running example. You can click the information iconinfo sign on pages to view the Data Layer code being passed for specific actions and views.

              At the end of each section, I will also provide Google’s more generalized code example for each type of implementation, via this Google support article. By comparing the examples from a live site (Ibby’s T-Shirt Shop) and Google’s generalized examples, you should be able to piece together everything you’ll need to properly pass information to the Data Layer.

              Measuring Product Impressions

              On Ibby’s homepage, click the info icon in the gray header. You’ll notice a few things: a dataLayer.push() containing an array of impressions. Each of these individual impressions contains an impressionFieldObject array containing id, name, price, brand, category, position, and list. Scroll further and you’ll see that the value for list changes from “homepage” to “shirts you may like”, indicating that the product impressions on this page belong to two different lists. This is a great example of how to pass impressions data to the Data Layer.

              Via Google, you can measure product impressions by pushing an impression action and the impressionFieldObject arrays to the Data Layer:

              <script>
              // Measures product impressions and also tracks a standard
              // pageview for the tag configuration.
              // Product impressions are sent by pushing an impressions object
              // containing one or more impressionFieldObjects.
              dataLayer.push({
                'ecommerce': {
                  'currencyCode': 'EUR',                       // Local currency is optional.
                  'impressions': [
                   {
                     'name': 'Triblend Android T-Shirt',       // Name or ID is required.
                     'id': '12345',
                     'price': '15.25',
                     'brand': 'Google',
                     'category': 'Apparel',
                     'variant': 'Gray',
                     'list': 'Search Results',
                     'position': 1
                   },
                   {
                     'name': 'Donut Friday Scented T-Shirt',
                     'id': '67890',
                     'price': '33.75',
                     'brand': 'Google',
                     'category': 'Apparel',
                     'variant': 'Black',
                     'list': 'Search Results',
                     'position': 2
                   }]
                }
              });
              </script>
              Measuring Promotion Impressions

              Return to Ibby’s homepage and click again the info icon in the header. Scroll past the list of impressions to the end of the code and find the block starting with “promoView”. This registers an impression of the “Back To School” right-rail ad on Ibby’s homepage. Notice that it is included with the long list of impressions, so within this code segment we have:

              1. Impressions of shirts in the “homepage” list
              2. Impressions of shirts in the “shirts you may like” list
              3. Impressions of a promotion

              Via Google, set the promoView key in the ecommerce data layer var to a promoFieldObject. Here is Google’s generalized example:

              <script>
              // An example of measuring promotion views. This example assumes that
              // information about the promotions displayed is available when the page loads.
              dataLayer.push({
                'ecommerce': {
                  'promoView': {
                    'promotions': [                     // Array of promoFieldObjects.
                     {
                       'id': 'JUNE_PROMO13',            // ID or Name is required.
                       'name': 'June Sale',
                       'creative': 'banner1',
                       'position': 'slot1'
                     },
                     {
                       'id': 'FREE_SHIP13',
                       'name': 'Free Shipping Promo',
                       'creative': 'skyscraper1',
                       'position': 'slot2'
                     }]
                  }
                }
              });
              </script>
              Measuring Promotion Clicks

              Staying on Ibby’s homepage, click on the info icon within the “Back to School” promotion. This code creates an event to register a click on a promotion.

              Via Google, push the promoClick action and the promoFieldObject array to the Data Layer. Here is Google’s more generalized example:

              <script>
              /**
               * Call this function when a user clicks on a promotion. This function uses the eventCallBack
               * datalayer variable to handle navigation after the ecommerce data is sent to Google Analytics.
               *
               * @param {Object} promoObj An object representing an internal site promotion.
               */
              function onPromoClick(promoObj) {
                dataLayer.push({
                  'event': 'promotionClick',
                  'ecommerce': {
                    'promoClick': {
                      'promotions': [
                       {
                         'id': promoObj.id,                         // Name or ID is required.
                         'name': promoObj.name,
                         'creative': promoObj.creative,
                         'position': promoObj.pos
                       }]
                    }
                  },
                  'eventCallback': function() {
                    document.location = promoObj.destinationUrl;
                  }
                });
              }
              </script>
              Measuring Product Clicks

              Staying on Ibby’s homepage, click one of the info icons in the upper right-hand corner of a shirt. When somebody clicks through to a shirt from a list of shirts, we want to register a click event. Notice now that, instead of an impressionFieldObject array, we are now switching to the productFieldObject array. This array contains a lot of the same data, but differentiates itself from a general high-level impression by declaring “products”.

              Via Google, push the click action to the Data Layer along with a productFieldObejct array containing information about the product that was clicked. Here is a more generalized example:

              <script>
              /**
               * Call this function when a user clicks on a product link. This function uses the event
               * callback datalayer variable to handle navigation after the ecommerce data has been sent
               * to Google Analytics.
               * @param {Object} productObj An object representing a product.
               */
              function(productObj) {
                dataLayer.push({
                  'event': 'productClick',
                  'ecommerce': {
                    'click': {
                      'actionField': {'list': 'Search Results'},      // Optional list property.
                      'products': [{
                        'name': productObj.name,                      // Name or ID is required.
                        'id': productObj.id,
                        'price': productObj.price,
                        'brand': productObj.brand,
                        'category': productObj.cat,
                        'variant': productObj.variant,
                        'position': productObj.position
                       }]
                     }
                   },
                   'eventCallback': function() {
                     document.location = productObj.url
                   }
                });
              }
              </script>
              Measuring View of Product Details

              I decided to click through to the “Compton T-Shirt” detail page on Ibby’s site so that I could learn more about the shirt. Click on the info icon to the upper right of the picture of the yellow shirt to see everything Ibby is passing to the Data Layer on this page. There are two things here that we’ve already seen: Product Impressions and Promotion Impressions. But in between these two lists in the code is a block that starts with “detail”: this is to signify a view of a product detail page. Notice that, similarly to the Product Click, we are also filling the productFieldObject array with data specific to the shirt.

              Generally, we will measure this product detail view by pushing a detail action and the productFieldObject to the data layer.

              <script>
              // Measure a view of product details. This example assumes the detail view occurs on pageload,
              // and also tracks a standard pageview of the details page.
              dataLayer.push({
                'ecommerce': {
                  'detail': {
                    'actionField': {'list': 'Apparel Gallery'},   // 'detail' actions have an optional list  
              property.
                    'products': [{
                      'name': 'Triblend Android T-Shirt',         // Name or ID is required.
                      'id': '12345',
                      'price': '15.25',
                      'brand': 'Google',
                      'category': 'Apparel',
                      'variant': 'Gray'
                     }]
                   }
                 }
              });
              </script>
              Adding a Product to a Shopping Cart

              Remaining on the “Compton T-Shirt” detail page, click the info icon next to the green “Add To Cart” button. This code registers a click event specific to adding an item to your cart.

              Via Google, measure an addition by passing add to the actionFieldObject and then passing the productFieldObject array as well.

              // Measure adding a product to a shopping cart by using an 'add' actionFieldObject
              // and a list of productFieldObjects.
              dataLayer.push({
                'event': 'addToCart',
                'ecommerce': {
                  'currencyCode': 'EUR',
                  'add': {                                // 'add' actionFieldObject measures.
                    'products': [{                        //  adding a product to a shopping cart.
                      'name': 'Triblend Android T-Shirt',
                      'id': '12345',
                      'price': '15.25',
                      'brand': 'Google',
                      'category': 'Apparel',
                      'variant': 'Gray',
                      'quantity': 1
                     }]
                  }
                }
              });
              Removing a Product from a Shopping Cart

              Similarly, click the info icon next to the red “Remove From Cart” button on the “Compton T-Shirt” detail page. The only difference between this and the “Add To Cart” code is that we’re using the removeFromCart event and passing remove to the actionFieldObject.

              // Measure the removal of a product from a shopping cart.
              dataLayer.push({
                'event': 'removeFromCart',
                'ecommerce': {
                  'remove': {                               // 'remove' actionFieldObject measures.
                    'products': [{                          //  removing a product to a shopping cart.
                        'name': 'Triblend Android T-Shirt',
                        'id': '12345',
                        'price': '15.25',
                        'brand': 'Google',
                        'category': 'Apparel',
                        'variant': 'Gray',
                        'quantity': 1
                    }]
                  }
                }
              });
              Measuring Checkout Steps

              Click the green “Checkout” button in the right-rail on any page of Ibby’s site. This will take you to a checkout process defined by the following steps:

              1. Start Checkout
              2. Customer Information
              3. Billing Information
              4. Review Cart
              5. Confirmation

              By clicking the info icon in the ribbon for each of these tabs, you’ll see that the main difference between each step is the “step” declaration in the actionField.

              Pass the checkout action as well as the step and productFieldObject arrays to the Data Layer. Here is a generalized example of step 1. Note the “option: Visa” in the actionField, we will discuss checkout options in more details in the next description.

              <script>
              /**
               * A function to handle a click on a checkout button. This function uses the eventCallback
               * data layer variable to handle navigation after the ecommerce data has been sent to Google Analytics.
               */
              function onCheckout() {
                dataLayer.push({
                  'event': 'checkout',
                  'ecommerce': {
                    'checkout': {
                      'actionField': {'step': 1, 'option': 'Visa'},
                      'products': [{
                        'name': 'Triblend Android T-Shirt',
                        'id': '12345',
                        'price': '15.25',
                        'brand': 'Google',
                        'category': 'Apparel',
                        'variant': 'Gray',
                        'quantity': 1
                     }]
                   }
                 },
                 'eventCallback': function() {
                    document.location = 'checkout.html';
                 }
                });
              }
              </script>
              Measuring Checkout Options

              Navigate to the Billing Information tab in Ibby’s checkout process and scroll down to the bottom of the form where you can choose your credit card option. Choose one of these options then click the info icon in the blue “Next” button. Assuming that a user cannot move on in the checkout process without declaring their form of payment, we’ll register a checkoutOption event when the user clicks to move on to the next step. Notice that the actionField contains both the step and the option.

              Here is a more generalized example from Google:

              <script>
              /**
               * A function to handle a click leading to a checkout option selection.
               */
              function onCheckoutOption(step, checkoutOption) {
                dataLayer.push({
                  'event': 'checkoutOption',
                  'ecommerce': {
                    'checkout_option': {
                      'actionField': {'step': step, 'option': checkoutOption}
                    }
                  }
                });
              }
              </script>
              Measuring Purchases

              Navigate to Ibby’s Review Cart tab and click the info icon next to the green “Purchase” button. Here Ibby passes the purchase action as well as a transaction event, which will be set up later to fire an enhanced ecommerce-enabled tag. Note that a transaction occurs on Ibby’s site when somebody clicks the “Purchase” button, thus requiring the transaction event. But, if Ibby’s site was configured such that a purchase confirmation was dependent on a pageview (maybe a thank you page), Ibby could do away with the transaction event and instead configure her GTM tag to trigger on a page view.

              Ibby also passes the transaction ID (or id) and the productFieldObject arrays for all products being purchased. Here is Google’s generalized example:

              <script>
              // Send transaction data with a pageview if available
              // when the page loads. Otherwise, use an event when the transaction
              // data becomes available.
              dataLayer.push({
                'ecommerce': {
                  'purchase': {
                    'actionField': {
                      'id': 'T12345',                         // Transaction ID. Required for purchases and refunds.
                      'affiliation': 'Online Store',
                      'revenue': '35.43',                     // Total transaction value (incl. tax and shipping)
                      'tax':'4.90',
                      'shipping': '5.99',
                      'coupon': 'SUMMER_SALE'
                    },
                    'products': [{                            // List of productFieldObjects.
                      'name': 'Triblend Android T-Shirt',     // Name or ID is required.
                      'id': '12345',
                      'price': '15.25',
                      'brand': 'Google',
                      'category': 'Apparel',
                      'variant': 'Gray',
                      'quantity': 1,
                      'coupon': ''                            // Optional fields may be omitted or set to empty string.
                     },
                     {
                      'name': 'Donut Friday Scented T-Shirt',
                      'id': '67890',
                      'price': '33.75',
                      'brand': 'Google',
                      'category': 'Apparel',
                      'variant': 'Black',
                      'quantity': 1
                     }]
                  }
                }
              });
              </script>
              Measuring Refunds

              Add any item to the cart in Ibby’s store and complete a checkout. On the confirmation page, you will see a red “Get a Refund!” button, click it. The resulting popup will have two more buttons: a red “Refund Full Cart” option and a yellow “Refund Selected Item(s)” button. Both of these are very similar, differing only in the addition of a productFieldObject on partial refunds to denote the specific products from the transaction that are to be refunded (as opposed to refunding every item being purchased).

              Here is Google’s generalized example of a full refund:

              <script>
              // Refund an entire transaction by providing the transaction ID. This example assumes the details
              // of the completed refund are available when the page loads:
              dataLayer.push({
                'ecommerce': {
                  'refund': {
                    'actionField': {'id': 'T12345'}         // Transaction ID. Required for purchases and refunds.
                  }
                }
              });
              </script>

              And here is Google’s generalized example of a partial refund:

              <script>
              // Measure a partial refund by providing an array of productFieldObjects and specifying the ID and
              // quantity of each product being returned. This example assumes the partial refund details are
              // known at the time the page loads:
              dataLayer.push({
                'ecommerce': {
                  'refund': {
                    'actionField': {'id': 'T12345'},        // Transaction ID.
                    'products': [
                          {'id': 'P4567', 'quantity': 1},   // Product ID and quantity. Required for partial refunds.
                          {'id': 'P8901','quantity': 2}
                     ]
                   }
                }
              });
              </script>
              Passing Product-Scoped Custom Dimensions

              Return to the “Compton T-Shirt” detail page and click the info icon next to the green “Add To Cart” button. Notice within the productFieldObject array that there is a non-standard variable dimension1 whose value is M. As mentioned before, there are a limited number of variables that Google recognizes automatically for enhanced ecommerce reports, but you can create product-scoped Custom Dimensions and Custom Metrics that will carry through in the productFieldObject array. Since the standard variant variable is already taking the color value, Ibby has used dimension1 to pass the size of the shirt through with the order.

              If you are unfamiliar with the general concept of custom dimensions & metrics, read this Google Support article.

              Here is Google’s generalized example of a product-scoped custom dimension, this example within a purchase action. Note that you can use these dimensions anywhere within the productFieldObject array.

              <script>
              dataLayer.push({
                'ecommerce': {
                  'purchase': {
                    ...
              
                    'products': [{
                      'name': 'Triblend Android T-Shirt',
                      'id': '12345',
                      'price': '15.25',
                      'brand': 'Google',
                      'category': 'Apparel',
                      'variant': 'Gray',
                      'dimension1': 'Same day delivery'
                     }]
                   }
                 }
              });
              </script>


              Section 5. Configuring Google Tag Manager

              For each of the different Data Layer implementations above, you will need to create tags in Google Tag Manager that will send this information from the Data Layer to Google Analytics. I will outline the tag setup for each type here. You can name your tags after the title of each section.

              Also note that these setups should be correct in most situations, but variations may arise depending on page structure, event setups in the Data Layer, and the way your CMS loads. If you need to make changes, start with conditions at the Track Type level and work from there.

              Product Impression

              Tag type : Universal Analytics
              Track type : Pageview
              Enable Enhanced Ecommerce Features: true
              Use Data Layer: true
              More settings > Fields to Set: select the field name page and set its value to {{page path}}
              Trigger: event equals gtm.dom

              Promotion Impression

              Tag type : Universal Analytics
              Track type : Pageview
              Enable Enhanced Ecommerce Features: true
              Use Data Layer: true
              More settings > Fields to Set: select the field name page and set its value to {{page path}}
              Trigger: event equals gtm.dom

              Promotion Click

              Tag type : Universal Analytics
              Track type : Event
              Event Category: Ecommerce
              Event Action: Promotion Click
              Enable Enhanced Ecommerce Features: true
              Use Data Layer: true
              More settings > Fields to Set: select the field name page and set its value to {{page path}}
              Trigger: event equals promotionClick

              Product Click

              Tag type : Universal Analytics
              Track type : Event
              Event Category: Ecommerce
              Event Action: Product Click
              Enable Enhanced Ecommerce Features: true
              Use Data Layer: true
              More settings > Fields to Set: select the field name page and set its value to {{page path}}
              Trigger: event equals productClick

              Product Detail Impression

              Tag type : Universal Analytics
              Track type : Pageview
              Enable Enhanced Ecommerce Features: true
              Use Data Layer: true
              More settings > Fields to Set: select the field name page and set its value to {{page path}}
              Trigger: event equals gtm.dom

              Add To Cart

              Tag type : Universal Analytics
              Track type : Event
              Event Category: Ecommerce
              Event Action: Add to Cart
              Enable Enhanced Ecommerce Features: true
              Use Data Layer: true
              More settings > Fields to Set: select the field name page and set its value to {{page path}}
              Trigger: event equals addToCart

              Remove From Cart

              Tag type : Universal Analytics
              Track type : Event
              Event Category: Ecommerce
              Event Action: Remove from Cart
              Enable Enhanced Ecommerce Features: true
              Use Data Layer: true
              More settings > Fields to Set: select the field name page and set its value to {{page path}}
              Trigger: event equals removeFromCart

              Checkout

              Tag type : Universal Analytics
              Track type : Event
              Event Category: Ecommerce
              Event Action: Checkout
              Enable Enhanced Ecommerce Features: true
              Use Data Layer: true
              More settings > Fields to Set: select the field name page and set its value to {{page path}}
              Trigger: event equals checkout

              Checkout Option

              Tag type : Universal Analytics
              Track type : Event
              Event Category: Ecommerce
              Event Action: Checkout Option
              Enable Enhanced Ecommerce Features: true
              Use Data Layer: true
              More settings > Fields to Set: select the field name page and set its value to {{page path}}
              Trigger: event equals checkoutOption

              Purchase (Pageview)

              Tag type : Universal Analytics
              Track type : Pageview
              Enable Enhanced Ecommerce Features: true
              Use Data Layer: true
              More settings > Fields to Set: select the field name page and set its value to {{page path}}
              Trigger: event equals gtm.dom

              Purchase (Transaction Event)

              Tag type : Universal Analytics
              Track type : Event
              Event Category: Ecommerce
              Event Action: Transaction
              Enable Enhanced Ecommerce Features: true
              Use Data Layer: true
              More settings > Fields to Set: select the field name page and set its value to {{page path}}
              Trigger: event equals transaction

              Refund

              Tag type : Universal Analytics
              Track type : Pageview
              Enable Enhanced Ecommerce Features: true
              Use Data Layer: true
              More settings > Fields to Set: select the field name page and set its value to {{page path}}
              Trigger: event equals gtm.dom

              Passing Product-Scoped Custom Dimensions and Metrics

              Rather than setting up a tag, you will need to define all custom dimensions as variables in GTM, and then declare those within your Universal Analytics tag (you will also need to set these up within Google Analytics, but we will discuss that in the next section).

              Ibby placed custom dimension dimension1 in her productFieldObject array to capture the size options (S, M, L) that a user chose before adding to cart. This dimension was persistent in the array through the entirety of the checkout process so that the size of the shirt could be attributed to the purchase. In order to pass this to GA with GTM, you first need to declare a Data Layer Variable named Size with Data Layer Variable Name = dimension1. Save this and go to the More settings dropdown in your Universal Analytics tag. Click on the Custom Dimensions dropdown, click Add Custom Dimension, set the Index equal to the dimension number (in this case 1) and the Dimension Value equal to the Size variable you just created.


              Section 6. Setting up Google Analytics for Enhanced Ecommerce

              Assuming that your Data Layer and GTM tags are set up and working properly, we can now set up Enhanced Ecommerce in our Google Analytics view.

              Turning on Enhance Ecommerce

              Go to the Admin tab in Google Analytics for your selected Account. Under View, you should see the Ecommerce Settings option. Click on that, then flip the switch for Enable Ecommerce Settings. This will bring up an optional Checkout Labeling widget, which is an option you should take for better shopping cart behavior reporting. All you need to do is add and name funnel steps according to your checkout process. When you are done, click Submit.

              Custom Dimensions and Metrics

              Go back to your Admin tab and find Custom Definitions. In our example for Ibby’s T-Shirt Shop, we set up dimension1 to pass the Size variable. Click on Custom Dimensions and the red New Custom Dimension button. Name the custom dimension Size and choose Product in the “scope” dropdown (the scope of a dimension is a whole ‘nother animal, but you should read about it here if you plan to enable any session, hit, user, or product-scoped dimensions in your Enhanced Ecommerce).


              Photo Credit: 123rf.com/5432action

              Let us solve your analytics problem.


                Most Common DIY Paid Search Mistakes

                All too often, we see companies attempt to dip their big toe in to the paid search (PPC) pool and come out on the other side disappointed with the swim. This usually leads to the assumption that PPC doesn’t work for their industry or isn’t profitable. However, when we conduct audits on existing accounts and present our findings, a few DIY mistakes stand out more often than not. These mistakes are a waste of your PPC budget and can definitely give the impression that PPC doesn’t work for you. However, after we help correct course and implement best practices, accounts can start producing results. If you’re looking for ways to improve your DIY PPC account, and start earning returns on your PPC spend, check out the list below. And if you’re in the market for an agency to partner with on strategy or execution, consider speaking with us.


                Sending All of Your PPC Traffic the Same Landing Page

                A targeted landing page that provides what was promised in your ad copy is the best way to turn clicks in to conversions. Some common mistakes we come across in PPC include not having enough landing pages to match your ad group themes, and sending all of your traffic to one corporate page in local situations. For instance, if I’m searching for a place to get an oil change and I click on your ad, the typical consumer is expecting to find direction information, relevant coupons, local pricing/specials, and a local phone number or appointment box. If you’re a national or regional brand with many locations and you send me to a top level page and make me dig for that information, I’m more likely to bounce from your landing page to seek assistance elsewhere.


                Overstuffing Ad Groups and Ignoring Themes

                Though this is a basic fundamental of PPC, I can’t tell you how many times I inherit accounts with way too many keywords in an ad group with little to no relation to one-another. Not only does this harm your click-thru rate because your ad copy + landing page experience can’t match to all of these keyword and search query variations, but you also end up hurting your account’s quality. By not being granular, you can inadvertently end up paying more per click, which leads to higher cost-per-leads and poor returns.


                Ignoring Campaign and Account Settings

                Settings are never a set it and forget it aspect of PPC. You should be building your campaigns with your goals in mind from the start and optimizing settings as your campaigns and goals evolve or as the search environment changes. It may not make sense for your campaign to be active or at full bidding capacity 24 hours a day, 7 days a week. Depending on sales you’re running, your conversion goals, sales staff availability, etc., consider: the hours and days you are running ads, when and where you’re increasing or decreasing bids, and how automation is working for or against you (if you’ve set it up at all). It’s a best practice in PPC to separate your search and display buys in to different campaigns so you can better align your strategy with network performance. I see this setting ignored in many DIY campaigns so campaigns are often opted in to both search/search partners and display. These networks perform differently from one another and can be better controlled by giving them separate campaigns, goals and budgets.


                Under or Over Bidding

                When you add keywords to an account or conduct regular reviews of existing keywords, take some time to review your Max CPC vs what you’re actually paying per click and what Google’s estimate for top of page, top position and first page bid. You don’t have to bid to position 1 to succeed in PPC. Keep track of how your average cost per click and position change over time to see the trends for your industry. It’s also a good idea to keep up to date with product changes on Google’s end so you can be aware of how your account may ebb or flow when they remove side rail ads and add an ad spot above the organic results.

                On the flip side, many accounts have a chronic under-bidding issue. Recently, I discovered in an account that many keyword bids were so low that the ads were rarely peeping above the bottom of page one. While the cost-per-click estimates were fairly high and cost-per-lead was over goal, it seemed counterintuitive to push bids even higher but a quick test showed that by making the bids more competitive, we could actually increase conversions and lower the CPL.

                In addition to Max CPC bidding, we often see a set-it-and-forget it attitude to bidding. For instance, using Google’s automated features like CPA bidding but not monitoring how it performs overtime. I’ve seen accounts spend less than half of what they are capable of due to under-setting the CPA goal. So while these tools aren’t necessarily useless, do exercise caution when setting them up and check in regularly.


                Photo credit: 123rf.com/belchonock

                Let us solve your PPC problem.