5 Analyses That Will Excite Your Client About Your Year End Analytics Reports
Recently I talked about year end reporting for ad agencies and why you should do year end web analytics reporting and analysis for your clients. Today I want to talk about five analyses that you should be covering in year end report. These are items that will help you identify potential opportunities, problems, and help you demonstrate your value to the client.
So without further adieu, the non-conclusive list:
1. Mobile vs Desktop
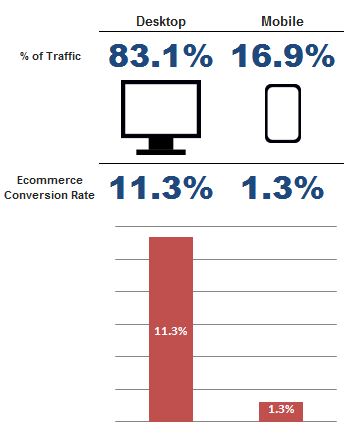
Mobile vs desktop traffic is the new timeless struggle when working with your clients. The old problem used to be convincing your client that developing for IE 6 didn’t matter. The task in performing this analysis is finding a way to convince your client it is important to increase investment in a mobile-optimized or responsive website (assuming it is necessary from the data). The answer is absolutely you can convince them and it just depends if it is worth it right now or not. Most of my clients are seeing a higher percentage of mobile traffic with each passing month. The problem though is that because their website isn’t optimized for the mobile web they tend to see lower conversion rates in comparison to their desktop brethren. It isn’t uncommon to see something like the following happening on a site.
As you can see, mobile makes up a healthy chunk of traffic, but it converts horribly. It is easier now than ever to pull this data from Google Analytics, but this might not convince them alone. You might have to go so far as predicting the performance of your mobile site if you had one by estimating how much in revenue was left on the table because your conversion rate was lower than it could have been. You can do that with the following equation.
This will help you get a rough estimate of what conversion you could have had, and the results can be incredible. If you are doing ecommerce take this a step further and use the average order size to estimate how much revenue was lost. So how does this affect my client? Well let’s just say that because they don’t have a mobile ecommerce site they are losing thousands of dollars in sales every month. Now tell me that won’t get your client’s attention and more work for you.
2. Marketing Channel Performance
Data in aggregate is nice, but it can never lead to any sort of real insight or action. There are many ways to divide up your data to draw comparisons and insights, but one of the quickest ways is by analyzing the differences in performance between marketing channels. As an agency you might be drawing people into a campaign through many means including paid sources like banner ads, and PPC, and non-paid sources such as SEO, social, and email. It is up to you to identify what is working and what isn’t. In Google Analytics you can quickly get this at a glance by comparing the conversion performance of each source to the site average. You can see below how much higher or lower a channel’s conversion rate is performing in comparison to the site average.
But go in-depth to see more than what channel isn’t performing up to snuff but also to identify the ad that is or isn’t working. If you can tell your client what to kill and what to double-down on in the data then you will have them eating from the palm of your hand.
Oh, and don’t forget to see how your social media work is coming along. And make sure you are trying to track social media as a whole the best way you can as social is notoriously difficult to track. Here is one way to help with that: see advanced segment four.
3. Unexpected Behavior
There are analytics beyond Google on the web. One of my favorites is crazyegg. It is a wonderfully simple tool that drives incredibly powerful insights (often ones which were unexpected).

Crazyegg shows where everyone on your site clicks, whether they clicked on a link or not, and presents it as a wonderful heat map. What this does is it shows how users view your site and can bring insights that you wouldn’t have thought of. For example, one client of mine had a landing page that we wanted to understand more clearly how customers interacted with the page. What did we find that was unexpected? That a huge percentage of people were clicking on an image of the logo that wasn’t a link. So, we were frustrating all of our users by making them think something was a link that wasn’t.
What unexpected behaviors are your website visitors doing? Find out and you will have won yourself new work because you found a way to fix it and make the customer happy.
4. Channels that are converting, but might not be getting their attribution
Is your highest converting traffic coming from direct traffic and organic search? Most likely. That tends to be the case for many websites. Does this mean you should shut down all of your other traffic sources that your client is spending money on? Not necessarily. Here’s why.
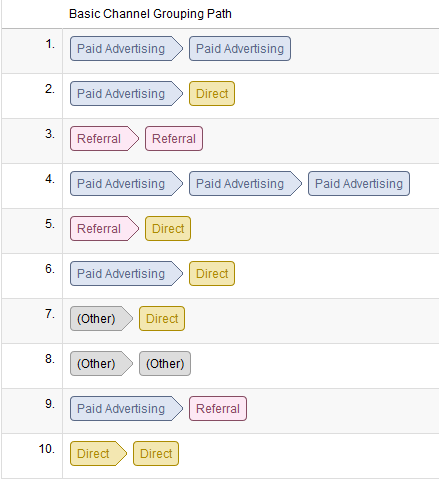
Some marketing channels do a great job helping along the path to purchase, but that might not be the way someone finally purchases. For example, if a business purchased the keyword ‘guitars’ in Google, that keyword would lead a user to visit the site. But, since a guitar is an expensive item, the customer might not purchase right away as they are doing their research. But when they finally decide to purchase they end up typing in your website directly into their browser to make the purchase because they already know about your awesome deal from their previous search.
Unfortunately, for a long time we didn’t have access to information about users who took multiple visits to make a purchase. In the end this led to some channels not getting the conversion attribution they deserved. So if Pay-Per-Click isn’t getting the credit it deserves, what happens if you were to shut it off? You lose more conversions than you would have thought, and this is bad.
Thankfully, if you are using Google Analytics you don’t have to guess. You can use the wonderful multi-channel conversion report and attribute conversions like a champ!
You can use this tool to great effect to really understand the affects of your advertising. So check it out in your analytics and show your client why your efforts deserve to be in their budget. Plus, if your client was the one who decided on paid search you will be able to compliment them on their wonderful success.
5. Listen To Your Client’s Customers
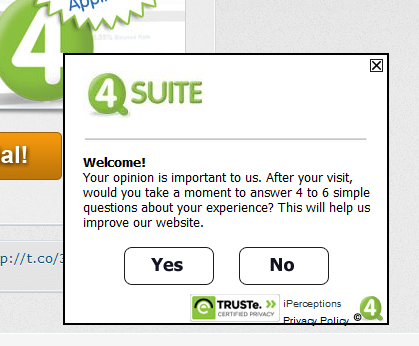
Listening to customers is one of the more profound analysis that is guaranteed to get your client’s attention in a report. How do you go about this listening tour? One of the easiest ways is to use the 4Q tool.
4Q allows you to ask four tried and true questions to help you gain insight into what is and isn’t working on your site. Talking to customers doesn’t need to be hard, time consuming, or financially draining. 4Q makes it really simple to hear what you customers have to say and it makes it really easy for your customers to say it. The four questions they suggest you ask to drive insight are:
1. Based on today’s visit, how would you rate your site experience overall?
2. Which of the following best describes the primary purpose of your visit?
3. Were you able to complete the purpose of your visit today?
4a. (If yes) What do you value most about the [sitename] website?
4b. (If no) Please tell us why you were not able to fully complete the purpose of your visit today.
After looking over a bunch of numbers in the rest of the report your client is going to read every single one of these answers. Why? Because this data is human and your client likely doesn’t talk to customers as often as they should. This stuff is gold to your client (unless the customers are unusually unhappy). But, this is the insight they crave because it is human to them. Forget the numbers; they will remember this part of the report.
And if what the customers say backs up the data, that’s even better as it is even more reason to act on the insights for your client. This is the information that if you’re not capturing for your client you are missing out on the potential of the web as a measured marketing medium. Use this and your report will be spread across the company, especially if it is happy data. The more people who see your report the more different departments in their company will be coming back to you for more projects.
These five things are just primers. You can include other targeted analyses for your client, but these items will be greatly appreciated and have the ability to drive more revenue for your agency and for your client.


