Enhanced Ecommerce is hard. Like, frustratingly hard. The setup is complex, time-consuming, and downright confusing, and it doesn’t help that Google’s support documents for the setup process are scattered and incomplete. But here at Flint Analytics, we decided to take all this disjointed documentation and bundle it all together in one mega-guide to understanding the Enhanced Ecommerce setup from start to finish. This post is intended to help you understand both the big picture reasons and nitty-gritty, step-by-step details in implementing Enhanced Ecommerce using Google Tag Manager and the Data Layer. The entire setup requires a fundamental understanding of some key factors, thus the sections are broken down as follows:
- What is Enhanced Ecommerce?
Understanding the reporting capabilities of Enhanced Ecommerce and the business motivation behind it.
- Understanding Ecommerce Data Types
Enhanced Ecommerce recognizes four data types (impression data, product data, promotion data, and action data), and this section describes the application and capabilities of each data type.
- Defining Tracking Requirements
Using the motivations and understanding from sections 1 and 2, you’ll need to figure out the specific tracking needs of the ecommerce site.
- Setting up the Data Layer
Converting variables from an ecommerce database into a format readable by Google Tag Manager.
- Configuring Google Tag Manager
Tag Manager will be used to facilitate the passing of data from the Data Layer to Google Analytics. This will require defining tags and variables.
- Setting up Google Analytics
How to enable Enhanced Ecommerce in a View and how to set up the Checkout Funnel.
Section 1. What is Enhanced Ecommerce?
Enhanced Ecommerce allows sites to segment their shopping behavior in a more granular way than the standard ecommerce and conversion reports in Google Analytics. Via this Google Support article, Enhanced Ecommerce provides the following metrics and reports that standard ecommerce and Google Analytics do not provide.
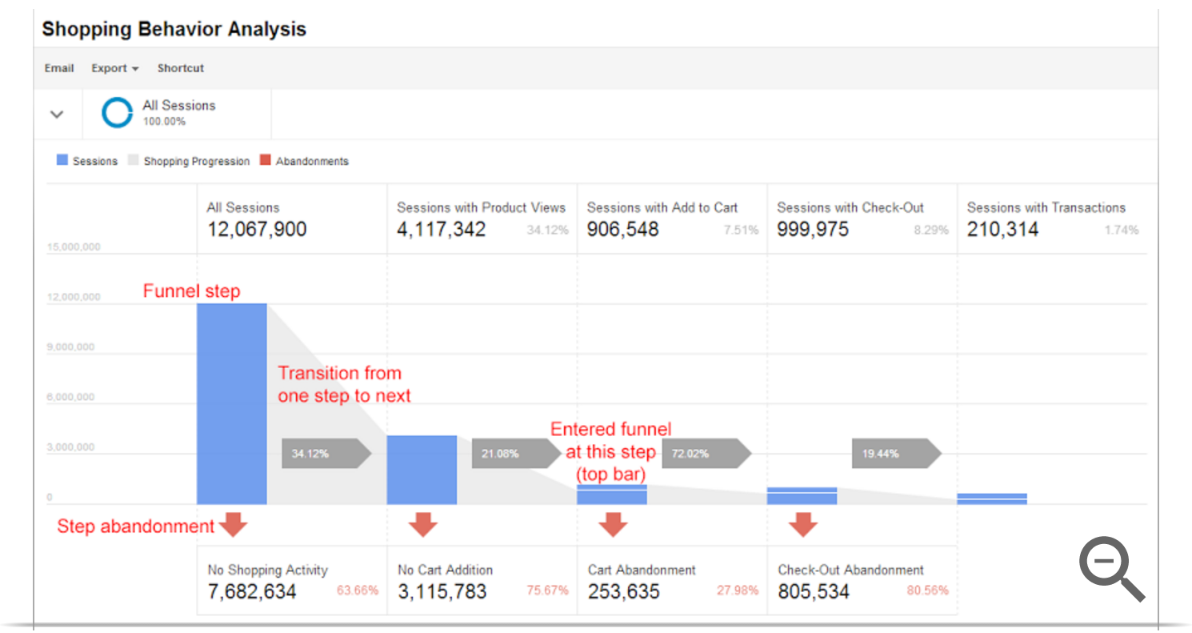
Shopping Behavior Analysis
This report allows you to analyze general site behavior from product impressions to transactions. So say, for instance, you wanted to know conversion rates between the following steps:
- Session Starts
- Product Impressions/Views
- Adds to Cart
- Checkouts
- Completed Transactions
This type of granularity allows you to find high-level inefficiencies in your sales funnel and gives a basis for making improvements. Here is an example of a Shopping Behavior Analysis report.
Checkout Behavior Analysis
This report is very similar to the Shopping Behavior Analysis report, but instead it is broken down into your checkout funnel steps. So, for example, let’s say that when a user on your site initiates the checkout process and carries through to a transaction, they follow these steps:
- Login
- Customer Information
- Billing Information
- Review Order
- Confirmation
This report would allow you to identify choke points in your checkout process and make improvements accordingly.
Product Performance
These reports allow you to view stats related to specific products. So say your store sold three types of shirts: green, yellow, and red. Where the Shopping Behavior Analysis and Checkout Behavior Analysis reports would show aggregate information for all shirts, a Product Performance Report would show information only about green shirts, yellow shirts, or red. From this report we can see ratios like the number of products added to cart and purchased compared to their total views, as well as product revenue, number of purchases, quantity sold, average price/quantity, number of refunds, impressions and product views, cart additions and removals, and whether or not the product was part of a list (to be discussed in detail later).
Sales Performance
This report shows all details related to ecommerce revenue, including transaction details, taxes, shipping, refunds, and quantity sold.
Product List Performance
Going back to our shirt example, let’s say the green, yellow, and red shirts are part of your “Stoplight Collection” (branding genius, I know). From an Enhanced Ecommerce perspective, these shirts would belong to the Stoplight Collection List. From this report, you’ll be able to break down the views and clicks through to a specific product from a list.
Internal Promotion
If you have any marketing materials on your site, say for instance an advertisement for a sale, you can categorize user behavior by the amount of impressions and clicks on promotions.
Order Coupon and Product Coupon
This allows you to segment data based on whether or not a coupon was used at either the product or order level.
Affiliate Code
If you have any affiliates, you can segment revenue based on their performance.
Section 2. Understanding Enhanced Ecommerce Data Types
Enhanced Ecommerce reports are dependent on a consistent and well-structured data stream. This is accomplished through implementing a richer Data Layer structure on the site that sends information in the form of impression data, product data, promotion data, and action data.
Impression Data
Say you want to know the conversion rate for a single product, from start to finish. For example, when somebody loads the homepage of your ecommerce site, they see a list of products: 3 shirts, 3 books, and 3 toys, summing to 9 total product impressions on that homepage. Each of those products may be shown on other pages within the site as well, as the customer continues browsing. Let’s say one of our shirts is shown on 3 different pages each during 10 different sessions. That would be 30 impressions of the same shirt across all 10 sessions. Let’s also say that during those 10 sessions, the shirt was purchased 1 time. So, the conversion rate for that shirt with respect to number of impressions would be 1/30 = 3.33%.
Each shirt, book, and toy is different from the other shirt, book, and toy, and carries with it some specific information on brand, category, price, etc. In the Data Layer, you can define an impressionFieldObject, which is an array containing all of the information about a specific product that is being viewed. So now let’s say you wanted to know the category conversion rate, where in this case, the categories are shirts, books, and toys. Let’s assume all 3 shirts are shown on all 3 pages during each of the 10 sessions, totaling to 90 shirts impressions. Let’s also assume that 5 shirts were purchased in the 10 sessions. The shirts conversion rate with respect to impressions is now 2/90 = 2.22%.
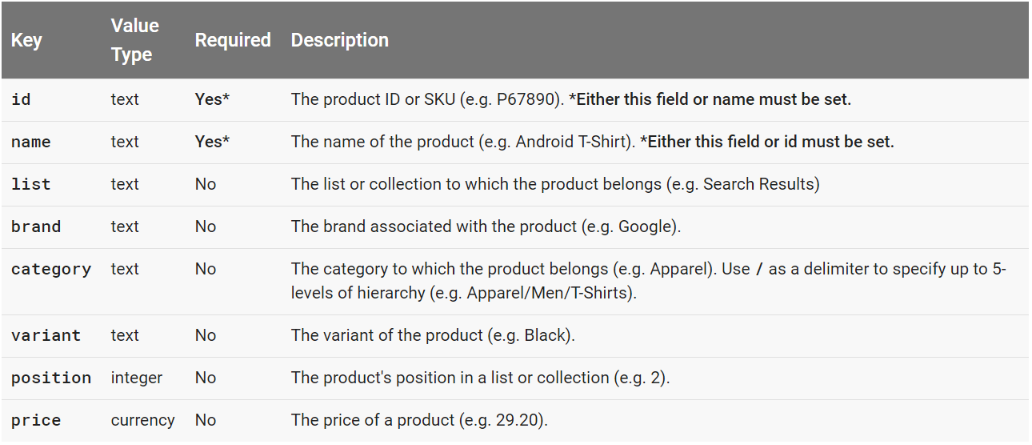
So, the general motivation for tracking product impressions is to allow ecommerce sites to segment their various products by different parameters for understanding conversion behavior. The following table lists and describes the variables that Google recognizes automatically in the impressionFieldObject array.
Product Data
Let’s go back to our original shirt example, where the same shirt was shown on 3 different pages during 10 sessions. Let’s say each impression of this shirt contains a link that directs to another page containing more information, or details, about the shirt itself. Of those 30 impressions, 3 of the 10 users click on the shirt during their session. That would mean that 3/30 = 10% of the product impressions result in the user clicking through to view more details about the product. This information can be used to understand what images/copy users respond to on the site, which products garner more interest, etc.
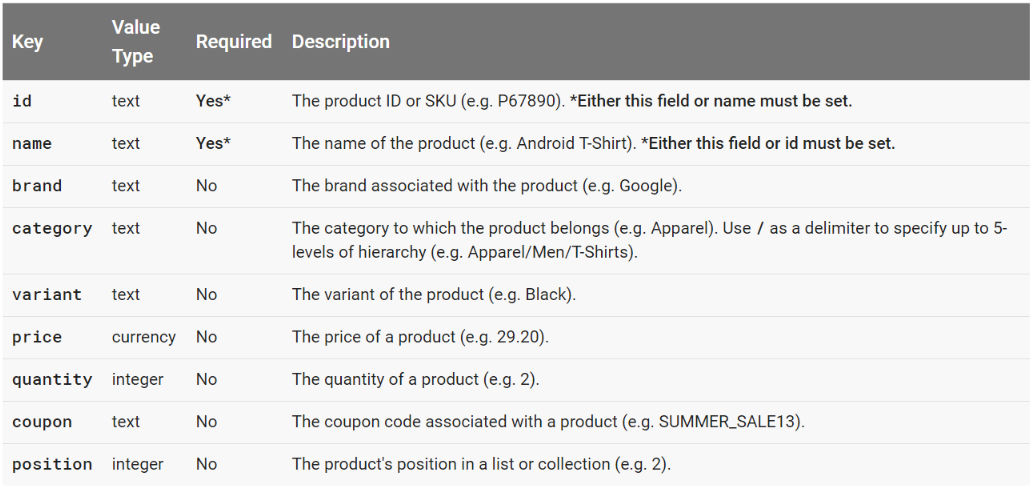
The productFieldObject array contains information specific to the product being viewed, and the following table contains variables that are automatically recognized by Google in this array.
Promotion Data
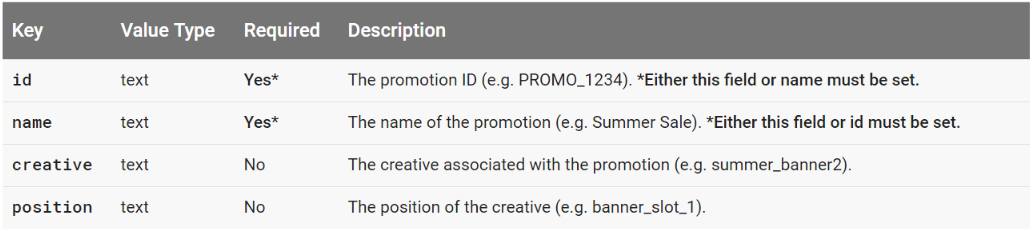
Say an ecommerce site is advertising a promotion on certain pages, such as an ad for a sale. You might want to know if the promotion has any effect on purchase volume and revenue, so you’ll want to know conversion rates relative to promotion impressions. The effect of specific promotions can be segmented using the variables in a promoFieldObject, which is described in the table below.
Action Data
Within an ecommerce site, several ecommerce-related actions can occur. Returning to our shirt example, let’s say you are currently on the product detail page for a specific shirt and you decide that you like the shirt enough to buy it. The first thing you’ll do is add that shirt to your cart. Then maybe that action will take you to the first step of the checkout process. Maybe you had previously added another shirt to the cart, but you’d rather have the new one, so you remove the original shirt from your cart. Now that you’ve got your cart in order, you finish the checkout process and make a purchase.
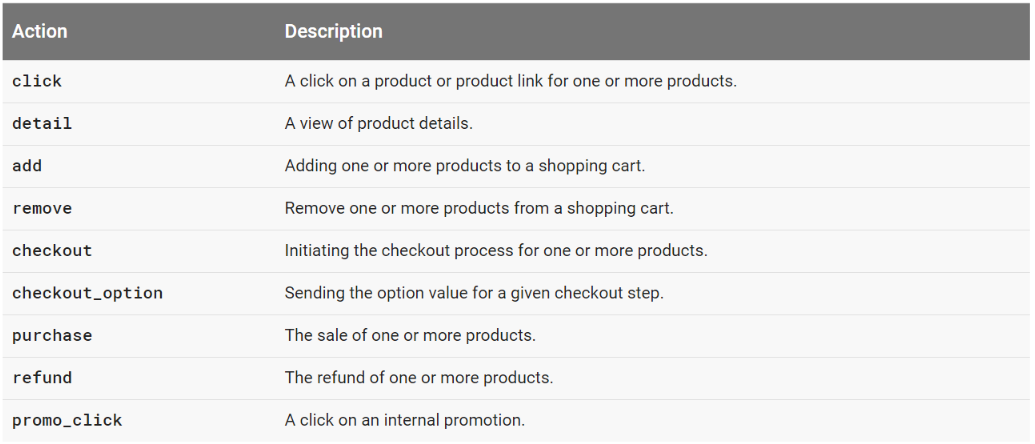
Each of these items is an action, and the following table lists and describes all of the ecommerce actions that Google recognizes automatically.
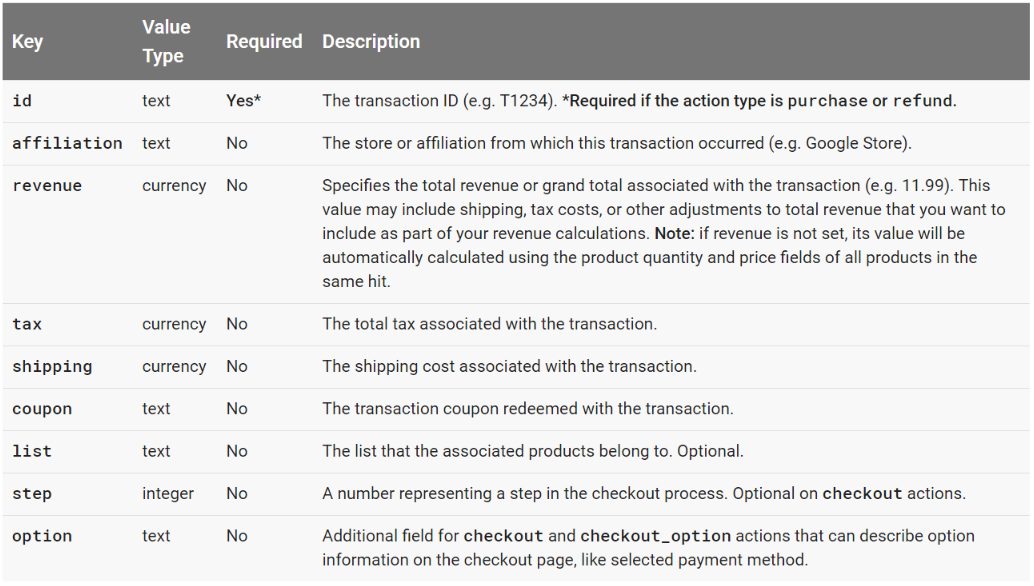
Each of these actions can carry action-specific data as well, which is defined by the actionFieldObject. On a purchase, for example, you would want to know total revenue of the transaction as well as the tax and shipping on the items sold. For an item being added to a cart, you might want to know which list it originated from (example, tickets for a specific Cincinnati Reds game might have originated from a list of upcoming Cincinnati Reds games).
Here are the specific variables recognized automatically by Google in the actionFieldObject.
Section 3. Defining Tracking Requirements
This portion of the process requires a fundamental understanding of the ecommerce site’s business model, Google’s predefined data types, and the types of reporting questions you may have. Let’s use Google’s fictitious Demo Store, Ibby’s T-Shirt Shop as an example for determining tracking requirements.
Ibby’s T-Shirt Shop Business Model
Ibby sells t-shirts. Those t-shirts have different colors, sizes, brands, prices, etc. When somebody goes to the site’s homepage, they are greeted with a list of different t-shirts (Compton, Comverges, Flexigen, etc). The user can choose which shirts to view and, potentially, purchase. When somebody makes a purchase, Ibby’s revenue is the price of the t-shirts sold multiplied by the quantity plus the tax cost plus the shipping cost.
It’s a pretty simple financial model, but how does Ibby know how to optimize the flow of her site to result in more purchases or higher revenue? That’s where defining the tracking requirements comes in.
Ibby’s Tracking Requirements
Using the lingo from Section 2, as well as Ibby’s website, let’s translate the entire sales process into Enhanced Ecommerce-speak. In the next section we will discuss the technical process for passing this data, but for now we just want to provide a framework for understanding what’s important from a business standpoint.
Product Impressions
In order to properly track the sales cycle of a product from start to finish, we want to track details specific to each impression of a product. On the homepage of Ibby’s site, note that each shirt can be uniquely identified through text (name, price, and ID) or picture (blank yellow shirt vs pink shirt with brick wall). Assumedly, your product database will contain all of the information unique to each product and you will want to pass this to Google Analytics for easier analysis. Refer back to the impressionFieldObject array described earlier: while it is required that you track product id and name, you should also track any of the following that you have available: list (ie homepage product list, suggested items list), brand, category (ie t-shirts, books, toys), variant (ie yellow, red), position (relative to other items in list), and price.
Product Clicks and Product Detail Impressions
While product impressions give users a preview of the t-shirts Ibby offers, product detail impressions give users more information and the option to add a specific shirt to their cart. Say you’re interested in the Flexigen T-Shirt, so you click (remember this is a defined action type) through to its product detail page. Most of the variables in the productFieldObject are the same as the impressionFieldObject, and with good reason: we want to have consistency when reporting the number of users who see a product on the site (product impression) and then choose to learn more about it (product detail impression).
Add Product to Cart
You’re on the product detail page and you’ve decided you’re going to buy the shirt. You choose the trim color and the size and then click the ‘Add To Cart’ button. Ibby may want to know the most popular color and size for the Flexigen T-Shirt, so she would define these in the productFieldObject for the add to cart action. As we saw before, variant is a predefined type, so we may assign trim color to that field. Since we can only use variant once, we’ll also need a way to track the size, which we can do with a custom dimension in the array (we will discuss the specifics of this implementation later, but it is important to note that most anything can be tracked, even variables outside of the scope of those that Google recognizes automatically).
Checkout
Ibby’s checkout process involves 5 steps:
- Start Checkout
- Customer Information
- Billing Information
- Review Cart
- Confirmation
In each of these steps, we will carry through the original product detail array that was populated during the add to cart action, and we will also track events that lead to cart abandonment.
Note on step 3, we have the option as a customer to select Visa, Mastercard, or AmEx as our preferred method of payment. This will be defined as a checkout option, another custom item that can be tracked for analysis purposes.
Purchase
This is the obvious goal for an ecommerce business, and we want to make sure that we are actively tracking the entire product detail array through to the purchase so that we can make optimizations and accurate reports about the entire sales process.
Other Variables and Actions That May Occur
Remember that somebody can usually remove an item from their cart, view or click on a promotion, request a refund, leave the checkout to continue shopping and return, etc. Review the data and action types from section 2 to determine what other variables and actions you may want to track.
Section 4. Setting Up the Data Layer
In short, the Data Layer is a JavaScript array that contains data readable by Google Tag Manager. If you are not familiar with the Data Layer, read this Google article first before proceeding.
How It Works
Via Simo Ahava, Enhanced Ecommerce via the Data Layer works in 4 simple steps:
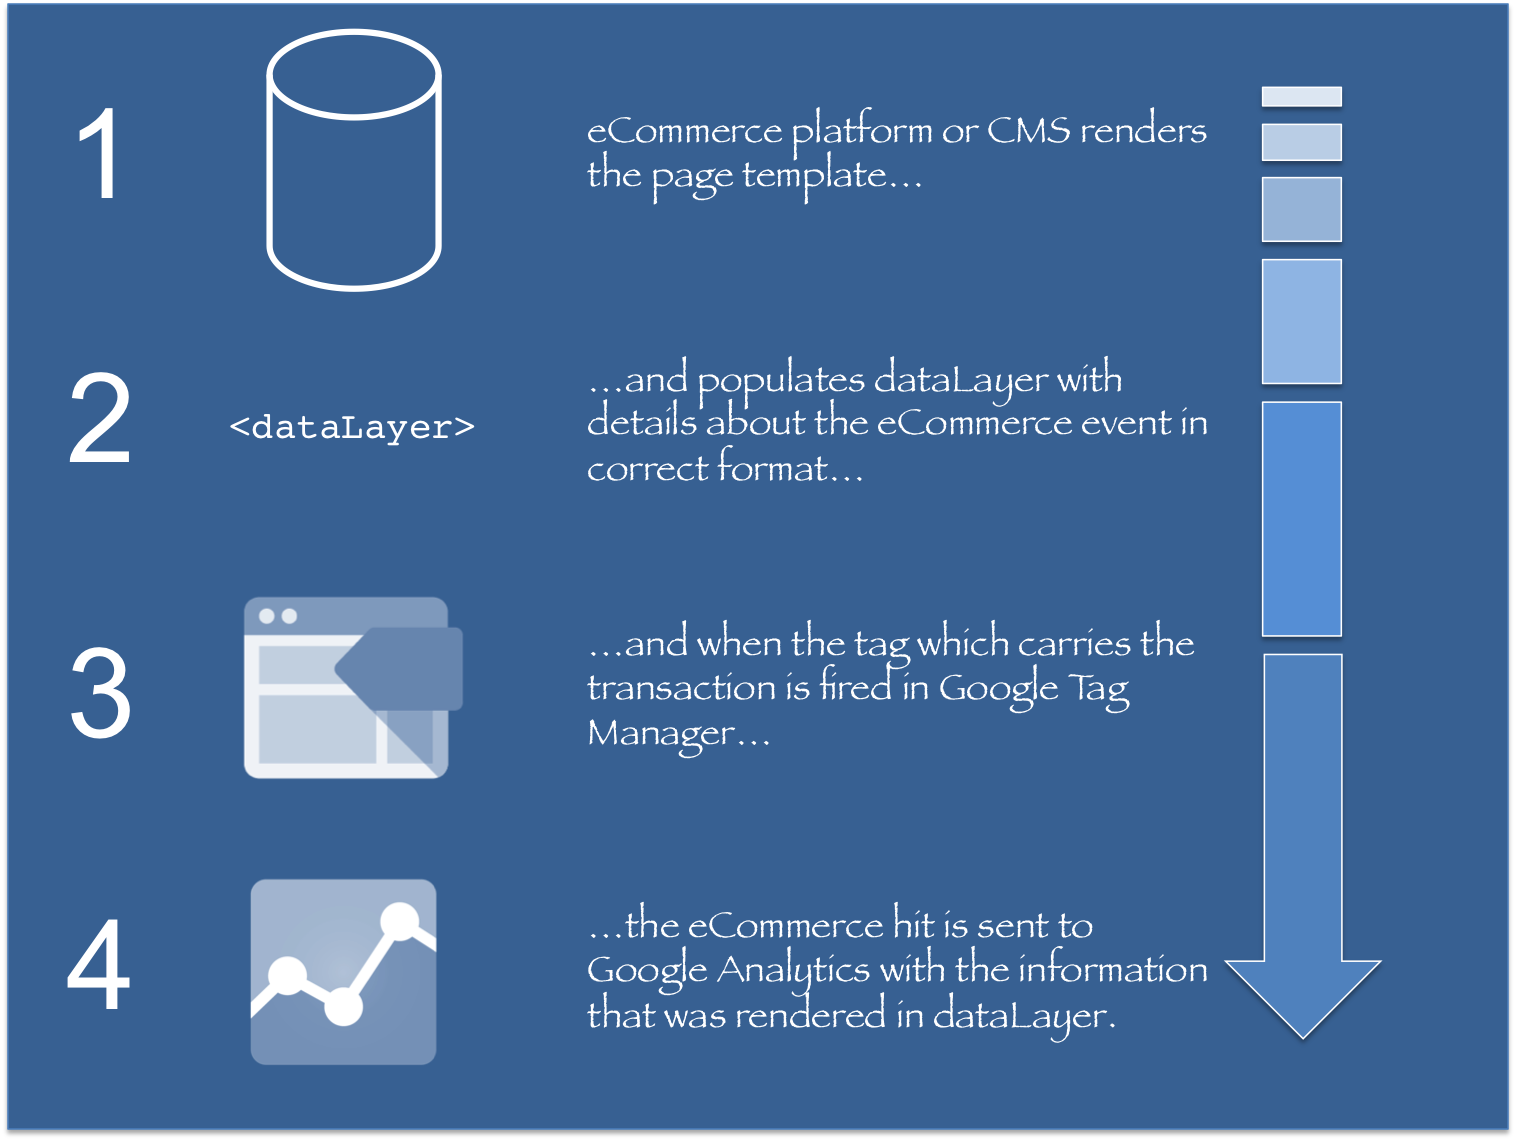
So essentially, the Data Layer translates data from the site’s platform, CMS, or database and converts it to a format readable by Google Tag Manager and then Google Analytics. This is important to note, as this particular piece of the puzzle will require the most communication with the development team.
Data Layer Code for Each Type of Action and View
We will use Ibby’s T-Shirt Shop as the example for each type of implementation, providing page-specific links for each step, so you can follow along for a running example. You can click the information icon on pages to view the Data Layer code being passed for specific actions and views.
At the end of each section, I will also provide Google’s more generalized code example for each type of implementation, via this Google support article. By comparing the examples from a live site (Ibby’s T-Shirt Shop) and Google’s generalized examples, you should be able to piece together everything you’ll need to properly pass information to the Data Layer.
Measuring Product Impressions
On Ibby’s homepage, click the info icon in the gray header. You’ll notice a few things: a dataLayer.push() containing an array of impressions. Each of these individual impressions contains an impressionFieldObject array containing id, name, price, brand, category, position, and list. Scroll further and you’ll see that the value for list changes from “homepage” to “shirts you may like”, indicating that the product impressions on this page belong to two different lists. This is a great example of how to pass impressions data to the Data Layer.
Via Google, you can measure product impressions by pushing an impression action and the impressionFieldObject arrays to the Data Layer:
<script>
// Measures product impressions and also tracks a standard
// pageview for the tag configuration.
// Product impressions are sent by pushing an impressions object
// containing one or more impressionFieldObjects.
dataLayer.push({
  'ecommerce': {
    'currencyCode': 'EUR',                       // Local currency is optional.
    'impressions': [
     {
       'name': 'Triblend Android T-Shirt',       // Name or ID is required.
       'id': '12345',
       'price': '15.25',
       'brand': 'Google',
       'category': 'Apparel',
       'variant': 'Gray',
       'list': 'Search Results',
       'position': 1
     },
     {
       'name': 'Donut Friday Scented T-Shirt',
       'id': '67890',
       'price': '33.75',
       'brand': 'Google',
       'category': 'Apparel',
       'variant': 'Black',
       'list': 'Search Results',
       'position': 2
     }]
  }
});
</script>
Measuring Promotion Impressions
Return to Ibby’s homepage and click again the info icon in the header. Scroll past the list of impressions to the end of the code and find the block starting with “promoView”. This registers an impression of the “Back To School” right-rail ad on Ibby’s homepage. Notice that it is included with the long list of impressions, so within this code segment we have:
- Impressions of shirts in the “homepage” list
- Impressions of shirts in the “shirts you may like” list
- Impressions of a promotion
Via Google, set the promoView key in the ecommerce data layer var to a promoFieldObject. Here is Google’s generalized example:
<script>
// An example of measuring promotion views. This example assumes that
// information about the promotions displayed is available when the page loads.
dataLayer.push({
  'ecommerce': {
    'promoView': {
      'promotions': [                     // Array of promoFieldObjects.
       {
         'id': 'JUNE_PROMO13',            // ID or Name is required.
         'name': 'June Sale',
         'creative': 'banner1',
         'position': 'slot1'
       },
       {
         'id': 'FREE_SHIP13',
         'name': 'Free Shipping Promo',
         'creative': 'skyscraper1',
         'position': 'slot2'
       }]
    }
  }
});
</script>
Measuring Promotion Clicks
Staying on Ibby’s homepage, click on the info icon within the “Back to School” promotion. This code creates an event to register a click on a promotion.
Via Google, push the promoClick action and the promoFieldObject array to the Data Layer. Here is Google’s more generalized example:
<script>
/**
 * Call this function when a user clicks on a promotion. This function uses the eventCallBack
 * datalayer variable to handle navigation after the ecommerce data is sent to Google Analytics.
 *
 * @param {Object} promoObj An object representing an internal site promotion.
 */
function onPromoClick(promoObj) {
  dataLayer.push({
    'event': 'promotionClick',
    'ecommerce': {
      'promoClick': {
        'promotions': [
         {
           'id': promoObj.id,                         // Name or ID is required.
           'name': promoObj.name,
           'creative': promoObj.creative,
           'position': promoObj.pos
         }]
      }
    },
    'eventCallback': function() {
      document.location = promoObj.destinationUrl;
    }
  });
}
</script>
Measuring Product Clicks
Staying on Ibby’s homepage, click one of the info icons in the upper right-hand corner of a shirt. When somebody clicks through to a shirt from a list of shirts, we want to register a click event. Notice now that, instead of an impressionFieldObject array, we are now switching to the productFieldObject array. This array contains a lot of the same data, but differentiates itself from a general high-level impression by declaring “products”.
Via Google, push the click action to the Data Layer along with a productFieldObejct array containing information about the product that was clicked. Here is a more generalized example:
<script>
/**
 * Call this function when a user clicks on a product link. This function uses the event
 * callback datalayer variable to handle navigation after the ecommerce data has been sent
 * to Google Analytics.
 * @param {Object} productObj An object representing a product.
 */
function(productObj) {
  dataLayer.push({
    'event': 'productClick',
    'ecommerce': {
      'click': {
        'actionField': {'list': 'Search Results'},      // Optional list property.
        'products': [{
          'name': productObj.name,                      // Name or ID is required.
          'id': productObj.id,
          'price': productObj.price,
          'brand': productObj.brand,
          'category': productObj.cat,
          'variant': productObj.variant,
          'position': productObj.position
         }]
       }
     },
     'eventCallback': function() {
       document.location = productObj.url
     }
  });
}
</script>
Measuring View of Product Details
I decided to click through to the “Compton T-Shirt” detail page on Ibby’s site so that I could learn more about the shirt. Click on the info icon to the upper right of the picture of the yellow shirt to see everything Ibby is passing to the Data Layer on this page. There are two things here that we’ve already seen: Product Impressions and Promotion Impressions. But in between these two lists in the code is a block that starts with “detail”: this is to signify a view of a product detail page. Notice that, similarly to the Product Click, we are also filling the productFieldObject array with data specific to the shirt.
Generally, we will measure this product detail view by pushing a detail action and the productFieldObject to the data layer.
<script>
// Measure a view of product details. This example assumes the detail view occurs on pageload,
// and also tracks a standard pageview of the details page.
dataLayer.push({
  'ecommerce': {
    'detail': {
      'actionField': {'list': 'Apparel Gallery'},   // 'detail' actions have an optional list
property.
      'products': [{
        'name': 'Triblend Android T-Shirt',         // Name or ID is required.
        'id': '12345',
        'price': '15.25',
        'brand': 'Google',
        'category': 'Apparel',
        'variant': 'Gray'
       }]
     }
   }
});
</script>
Adding a Product to a Shopping Cart
Remaining on the “Compton T-Shirt” detail page, click the info icon next to the green “Add To Cart” button. This code registers a click event specific to adding an item to your cart.
Via Google, measure an addition by passing add to the actionFieldObject and then passing the productFieldObject array as well.
// Measure adding a product to a shopping cart by using an 'add' actionFieldObject
// and a list of productFieldObjects.
dataLayer.push({
  'event': 'addToCart',
  'ecommerce': {
    'currencyCode': 'EUR',
    'add': {                                // 'add' actionFieldObject measures.
      'products': [{                        //  adding a product to a shopping cart.
        'name': 'Triblend Android T-Shirt',
        'id': '12345',
        'price': '15.25',
        'brand': 'Google',
        'category': 'Apparel',
        'variant': 'Gray',
        'quantity': 1
       }]
    }
  }
});
Removing a Product from a Shopping Cart
Similarly, click the info icon next to the red “Remove From Cart” button on the “Compton T-Shirt” detail page. The only difference between this and the “Add To Cart” code is that we’re using the removeFromCart event and passing remove to the actionFieldObject.
// Measure the removal of a product from a shopping cart.
dataLayer.push({
  'event': 'removeFromCart',
  'ecommerce': {
    'remove': {                               // 'remove' actionFieldObject measures.
      'products': [{                          //  removing a product to a shopping cart.
          'name': 'Triblend Android T-Shirt',
          'id': '12345',
          'price': '15.25',
          'brand': 'Google',
          'category': 'Apparel',
          'variant': 'Gray',
          'quantity': 1
      }]
    }
  }
});
Measuring Checkout Steps
Click the green “Checkout” button in the right-rail on any page of Ibby’s site. This will take you to a checkout process defined by the following steps:
- Start Checkout
- Customer Information
- Billing Information
- Review Cart
- Confirmation
By clicking the info icon in the ribbon for each of these tabs, you’ll see that the main difference between each step is the “step” declaration in the actionField.
Pass the checkout action as well as the step and productFieldObject arrays to the Data Layer. Here is a generalized example of step 1. Note the “option: Visa” in the actionField, we will discuss checkout options in more details in the next description.
<script>
/**
 * A function to handle a click on a checkout button. This function uses the eventCallback
 * data layer variable to handle navigation after the ecommerce data has been sent to Google Analytics.
 */
function onCheckout() {
  dataLayer.push({
    'event': 'checkout',
    'ecommerce': {
      'checkout': {
        'actionField': {'step': 1, 'option': 'Visa'},
        'products': [{
          'name': 'Triblend Android T-Shirt',
          'id': '12345',
          'price': '15.25',
          'brand': 'Google',
          'category': 'Apparel',
          'variant': 'Gray',
          'quantity': 1
       }]
     }
   },
   'eventCallback': function() {
      document.location = 'checkout.html';
   }
  });
}
</script>
Measuring Checkout Options
Navigate to the Billing Information tab in Ibby’s checkout process and scroll down to the bottom of the form where you can choose your credit card option. Choose one of these options then click the info icon in the blue “Next” button. Assuming that a user cannot move on in the checkout process without declaring their form of payment, we’ll register a checkoutOption event when the user clicks to move on to the next step. Notice that the actionField contains both the step and the option.
Here is a more generalized example from Google:
<script>
/**
 * A function to handle a click leading to a checkout option selection.
 */
function onCheckoutOption(step, checkoutOption) {
  dataLayer.push({
    'event': 'checkoutOption',
    'ecommerce': {
      'checkout_option': {
        'actionField': {'step': step, 'option': checkoutOption}
      }
    }
  });
}
</script>
Measuring Purchases
Navigate to Ibby’s Review Cart tab and click the info icon next to the green “Purchase” button. Here Ibby passes the purchase action as well as a transaction event, which will be set up later to fire an enhanced ecommerce-enabled tag. Note that a transaction occurs on Ibby’s site when somebody clicks the “Purchase” button, thus requiring the transaction event. But, if Ibby’s site was configured such that a purchase confirmation was dependent on a pageview (maybe a thank you page), Ibby could do away with the transaction event and instead configure her GTM tag to trigger on a page view.
Ibby also passes the transaction ID (or id) and the productFieldObject arrays for all products being purchased. Here is Google’s generalized example:
<script>
// Send transaction data with a pageview if available
// when the page loads. Otherwise, use an event when the transaction
// data becomes available.
dataLayer.push({
  'ecommerce': {
    'purchase': {
      'actionField': {
        'id': 'T12345',                         // Transaction ID. Required for purchases and refunds.
        'affiliation': 'Online Store',
        'revenue': '35.43',                     // Total transaction value (incl. tax and shipping)
        'tax':'4.90',
        'shipping': '5.99',
        'coupon': 'SUMMER_SALE'
      },
      'products': [{                            // List of productFieldObjects.
        'name': 'Triblend Android T-Shirt',     // Name or ID is required.
        'id': '12345',
        'price': '15.25',
        'brand': 'Google',
        'category': 'Apparel',
        'variant': 'Gray',
        'quantity': 1,
        'coupon': ''                            // Optional fields may be omitted or set to empty string.
       },
       {
        'name': 'Donut Friday Scented T-Shirt',
        'id': '67890',
        'price': '33.75',
        'brand': 'Google',
        'category': 'Apparel',
        'variant': 'Black',
        'quantity': 1
       }]
    }
  }
});
</script>
Measuring Refunds
Add any item to the cart in Ibby’s store and complete a checkout. On the confirmation page, you will see a red “Get a Refund!” button, click it. The resulting popup will have two more buttons: a red “Refund Full Cart” option and a yellow “Refund Selected Item(s)” button. Both of these are very similar, differing only in the addition of a productFieldObject on partial refunds to denote the specific products from the transaction that are to be refunded (as opposed to refunding every item being purchased).
Here is Google’s generalized example of a full refund:
<script>
// Refund an entire transaction by providing the transaction ID. This example assumes the details
// of the completed refund are available when the page loads:
dataLayer.push({
  'ecommerce': {
    'refund': {
      'actionField': {'id': 'T12345'}         // Transaction ID. Required for purchases and refunds.
    }
  }
});
</script>
And here is Google’s generalized example of a partial refund:
<script>
// Measure a partial refund by providing an array of productFieldObjects and specifying the ID and
// quantity of each product being returned. This example assumes the partial refund details are
// known at the time the page loads:
dataLayer.push({
  'ecommerce': {
    'refund': {
      'actionField': {'id': 'T12345'},        // Transaction ID.
      'products': [
            {'id': 'P4567', 'quantity': 1},   // Product ID and quantity. Required for partial refunds.
            {'id': 'P8901','quantity': 2}
       ]
     }
  }
});
</script>
Passing Product-Scoped Custom Dimensions
Return to the “Compton T-Shirt” detail page and click the info icon next to the green “Add To Cart” button. Notice within the productFieldObject array that there is a non-standard variable dimension1 whose value is M. As mentioned before, there are a limited number of variables that Google recognizes automatically for enhanced ecommerce reports, but you can create product-scoped Custom Dimensions and Custom Metrics that will carry through in the productFieldObject array. Since the standard variant variable is already taking the color value, Ibby has used dimension1 to pass the size of the shirt through with the order.
If you are unfamiliar with the general concept of custom dimensions & metrics, read this Google Support article.
Here is Google’s generalized example of a product-scoped custom dimension, this example within a purchase action. Note that you can use these dimensions anywhere within the productFieldObject array.
<script>
dataLayer.push({
  'ecommerce': {
    'purchase': {
      ...

      'products': [{
        'name': 'Triblend Android T-Shirt',
        'id': '12345',
        'price': '15.25',
        'brand': 'Google',
        'category': 'Apparel',
        'variant': 'Gray',
        'dimension1': 'Same day delivery'
       }]
     }
   }
});
</script>
Section 5. Configuring Google Tag Manager
For each of the different Data Layer implementations above, you will need to create tags in Google Tag Manager that will send this information from the Data Layer to Google Analytics. I will outline the tag setup for each type here. You can name your tags after the title of each section.
Also note that these setups should be correct in most situations, but variations may arise depending on page structure, event setups in the Data Layer, and the way your CMS loads. If you need to make changes, start with conditions at the Track Type level and work from there.
Product Impression
Tag type : Universal Analytics
Track type : Pageview
Enable Enhanced Ecommerce Features: true
Use Data Layer: true
More settings > Fields to Set: select the field name page and set its value to {{page path}}
Trigger: event equals gtm.dom
Promotion Impression
Tag type : Universal Analytics
Track type : Pageview
Enable Enhanced Ecommerce Features: true
Use Data Layer: true
More settings > Fields to Set: select the field name page and set its value to {{page path}}
Trigger: event equals gtm.dom
Promotion Click
Tag type : Universal Analytics
Track type : Event
Event Category: Ecommerce
Event Action: Promotion Click
Enable Enhanced Ecommerce Features: true
Use Data Layer: true
More settings > Fields to Set: select the field name page and set its value to {{page path}}
Trigger: event equals promotionClick
Product Click
Tag type : Universal Analytics
Track type : Event
Event Category: Ecommerce
Event Action: Product Click
Enable Enhanced Ecommerce Features: true
Use Data Layer: true
More settings > Fields to Set: select the field name page and set its value to {{page path}}
Trigger: event equals productClick
Product Detail Impression
Tag type : Universal Analytics
Track type : Pageview
Enable Enhanced Ecommerce Features: true
Use Data Layer: true
More settings > Fields to Set: select the field name page and set its value to {{page path}}
Trigger: event equals gtm.dom
Add To Cart
Tag type : Universal Analytics
Track type : Event
Event Category: Ecommerce
Event Action: Add to Cart
Enable Enhanced Ecommerce Features: true
Use Data Layer: true
More settings > Fields to Set: select the field name page and set its value to {{page path}}
Trigger: event equals addToCart
Remove From Cart
Tag type : Universal Analytics
Track type : Event
Event Category: Ecommerce
Event Action: Remove from Cart
Enable Enhanced Ecommerce Features: true
Use Data Layer: true
More settings > Fields to Set: select the field name page and set its value to {{page path}}
Trigger: event equals removeFromCart
Checkout
Tag type : Universal Analytics
Track type : Event
Event Category: Ecommerce
Event Action: Checkout
Enable Enhanced Ecommerce Features: true
Use Data Layer: true
More settings > Fields to Set: select the field name page and set its value to {{page path}}
Trigger: event equals checkout
Checkout Option
Tag type : Universal Analytics
Track type : Event
Event Category: Ecommerce
Event Action: Checkout Option
Enable Enhanced Ecommerce Features: true
Use Data Layer: true
More settings > Fields to Set: select the field name page and set its value to {{page path}}
Trigger: event equals checkoutOption
Purchase (Pageview)
Tag type : Universal Analytics
Track type : Pageview
Enable Enhanced Ecommerce Features: true
Use Data Layer: true
More settings > Fields to Set: select the field name page and set its value to {{page path}}
Trigger: event equals gtm.dom
Purchase (Transaction Event)
Tag type : Universal Analytics
Track type : Event
Event Category: Ecommerce
Event Action: Transaction
Enable Enhanced Ecommerce Features: true
Use Data Layer: true
More settings > Fields to Set: select the field name page and set its value to {{page path}}
Trigger: event equals transaction
Refund
Tag type : Universal Analytics
Track type : Pageview
Enable Enhanced Ecommerce Features: true
Use Data Layer: true
More settings > Fields to Set: select the field name page and set its value to {{page path}}
Trigger: event equals gtm.dom
Passing Product-Scoped Custom Dimensions and Metrics
Rather than setting up a tag, you will need to define all custom dimensions as variables in GTM, and then declare those within your Universal Analytics tag (you will also need to set these up within Google Analytics, but we will discuss that in the next section).
Ibby placed custom dimension dimension1 in her productFieldObject array to capture the size options (S, M, L) that a user chose before adding to cart. This dimension was persistent in the array through the entirety of the checkout process so that the size of the shirt could be attributed to the purchase. In order to pass this to GA with GTM, you first need to declare a Data Layer Variable named Size with Data Layer Variable Name = dimension1. Save this and go to the More settings dropdown in your Universal Analytics tag. Click on the Custom Dimensions dropdown, click Add Custom Dimension, set the Index equal to the dimension number (in this case 1) and the Dimension Value equal to the Size variable you just created.
Section 6. Setting up Google Analytics for Enhanced Ecommerce
Assuming that your Data Layer and GTM tags are set up and working properly, we can now set up Enhanced Ecommerce in our Google Analytics view.
Turning on Enhance Ecommerce
Go to the Admin tab in Google Analytics for your selected Account. Under View, you should see the Ecommerce Settings option. Click on that, then flip the switch for Enable Ecommerce Settings. This will bring up an optional Checkout Labeling widget, which is an option you should take for better shopping cart behavior reporting. All you need to do is add and name funnel steps according to your checkout process. When you are done, click Submit.
Custom Dimensions and Metrics
Go back to your Admin tab and find Custom Definitions. In our example for Ibby’s T-Shirt Shop, we set up dimension1 to pass the Size variable. Click on Custom Dimensions and the red New Custom Dimension button. Name the custom dimension Size and choose Product in the “scope” dropdown (the scope of a dimension is a whole ‘nother animal, but you should read about it here if you plan to enable any session, hit, user, or product-scoped dimensions in your Enhanced Ecommerce).
Let us solve your analytics problem.